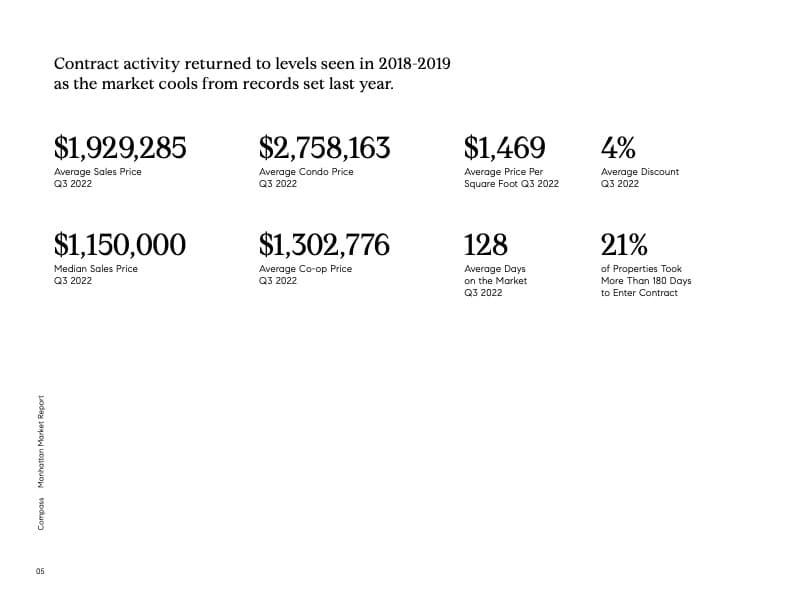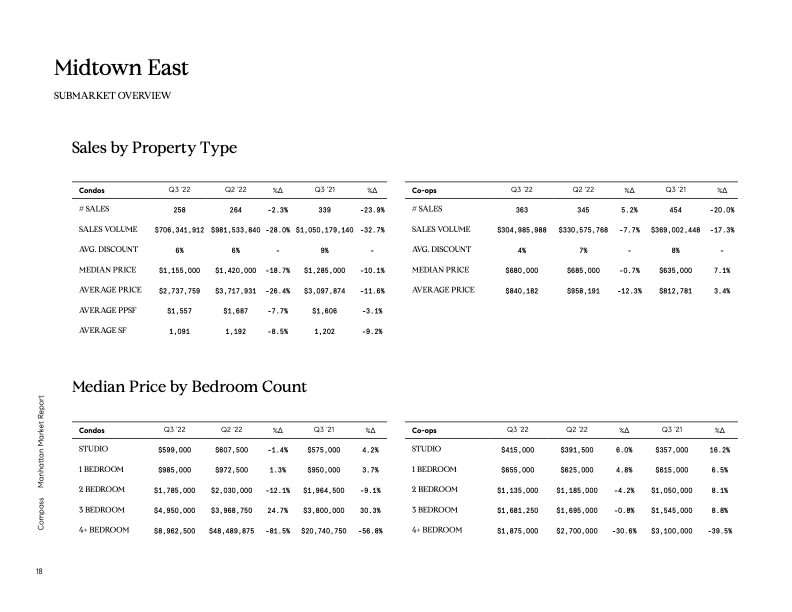
The average sales price in Q3 of 2022 will be $1,929,285. This is higher than Q2 of 2022, during which the average sales price was $1,821,691. The median sales price in Q3 of 2022 is $1,150,000. This is a decrease from Q2 of 2022, where the median sales price was $1,195,000.
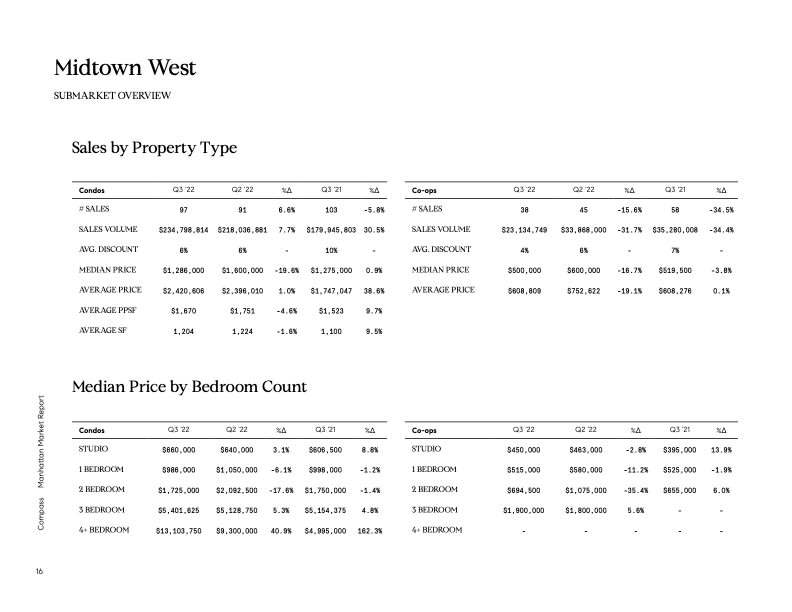
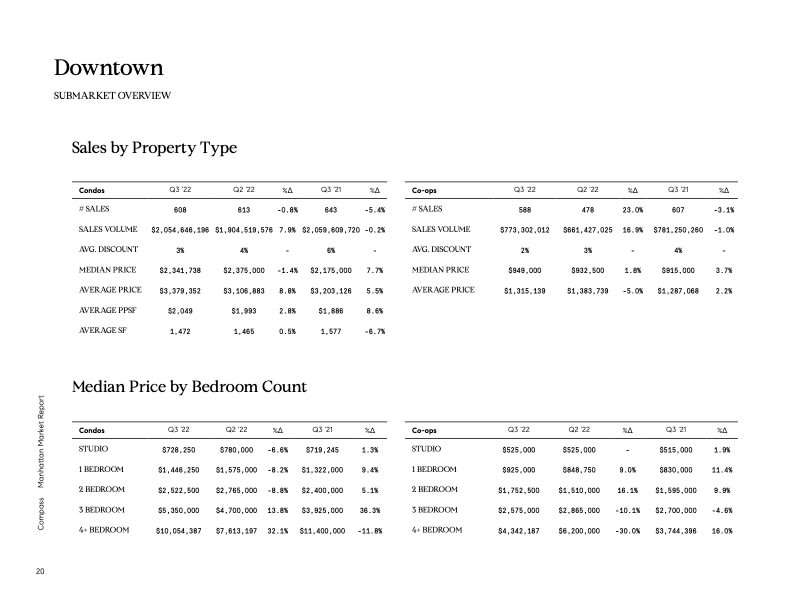
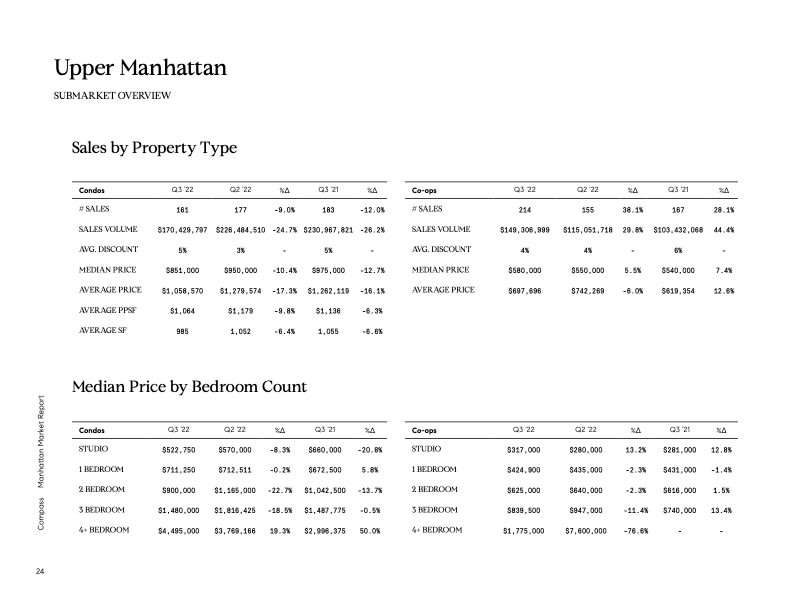
Condo prices averaged $2,758,163 in Q3 of 2022 and co-op prices averaged $1,302,776 during the same time period. These prices are both increases from Q2 of 2022. The average days on the market decreased slightly to 128 days in Q3 of 2022. The average discount increased to 4%. Out of all properties that went into contract in Q3 of 2022, 21% took more than 180 days to enter contract.
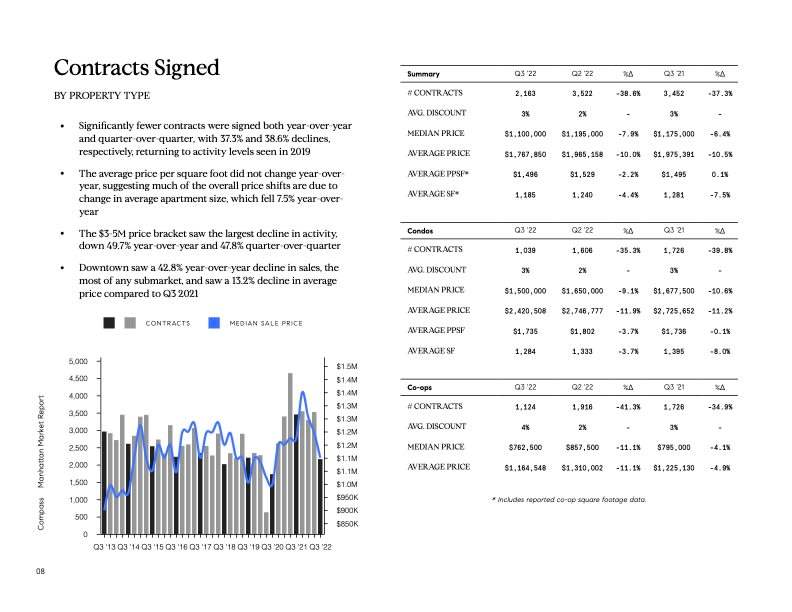
Q3 Contract Activity Returns to 2018-2019 Levels as Market Cools From Records Set Last Year
The most recent quarter brought a return to more typical market conditions after last year’s record-setting growth. Overall contract activity—the number of listing contracts signed—decreased 5 percent compared to last year’s all-time high. However, this figure still represented an increase compared to levels seen in 2018 and 2019.
Prices dipped below record highs set in the previous quarter but remained elevated relative to pre-pandemic levels—more evidence that the market has yet to fully cool off from last year’s frenzy. Nevertheless, with some buyers pulling back and properties staying on the market for longer periods of time, there are early signs that buyer momentum may be waning and we could see a more sustained slowdown in the months ahead.
How Long Are Properties Staying on the Market?
The average days on market (DOM) increased 2 percent compared to last year and 6 percent relative to the previous quarter—indicating that it took slightly longer to sell a home in Q3 than in recent quarters but still less time than before the pandemic began. DOM averaged 128 days this quarter compared to 125 days last quarter and 136 days during Q3 2019—the longest DOM seen since 2013 when it averaged 133 days during that same quarter.
Seller incentives also ticked up this quarter as sellers offered an average discount of 4 percent compared to 3 percent last quarter—the highest level since 2017 when homes sold at an average discount of 5 percent during that same quarter. Both trends point to a slight softening of conditions as we move into the fall season with buyers becoming less frenzied and feeling less pressure to purchase quickly out of fear of missing out on scarce homes for sale or seeing prices move even higher out their reach.
What’s Next for New York City Real Estate?
It is still too early too say definitively whether we are seeing a temporary slowdown or a more sustained shift in market conditions. In order for there to be a more meaningful correction—i.e., a sustained drop in prices and/or increase in inventory—we would likely need to see job losses or another shock to our economic recovery such as a second wave of coronavirus infections coupled with renewed restrictions on indoor gatherings and business operations later this year or early next year. However, even if we do see some type of correction it would likely be nothing like what we experienced during the Great Recession when home prices fell by almost 30 percent and transaction volume plunged 60 percent over several years beginning in 2006-2007 as Lehman Brothers collapsed and credit markets froze up virtually overnight around the globe.
While the bidding wars and soaring prices of 2021 may be over, it would be a mistake to sour on Manhattan real estate in the long run. New York real estate has historically appreciated and people will always need a place to live. For savvy investors, now may be a good time to get back into the market.