Thrive Real Estate Team at Compass

The August 2023 Snapshot has been released and is full of insights on the rental market in NYC. Check it out for statistics and trends! #August2023report #thriveatcompass #NYC

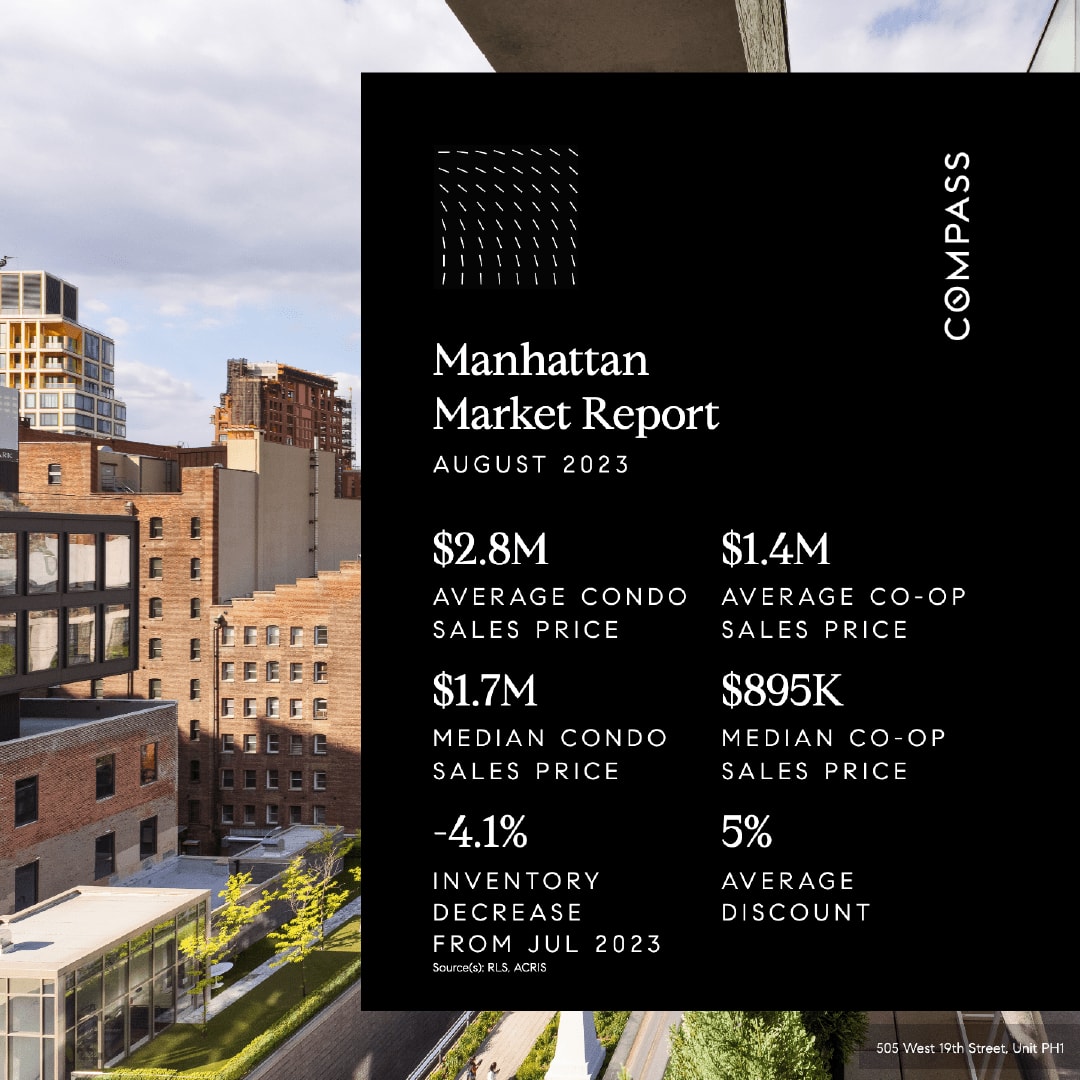
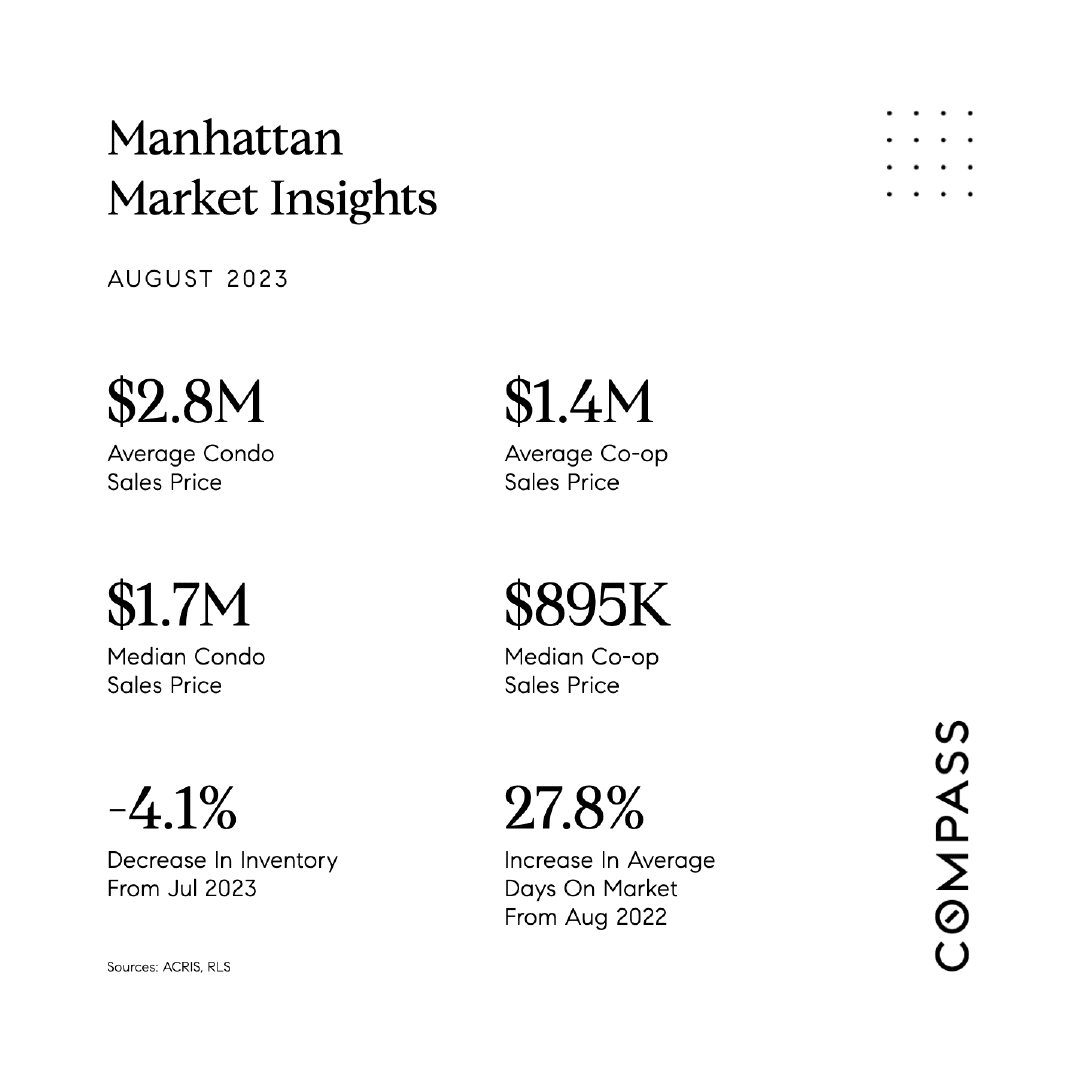
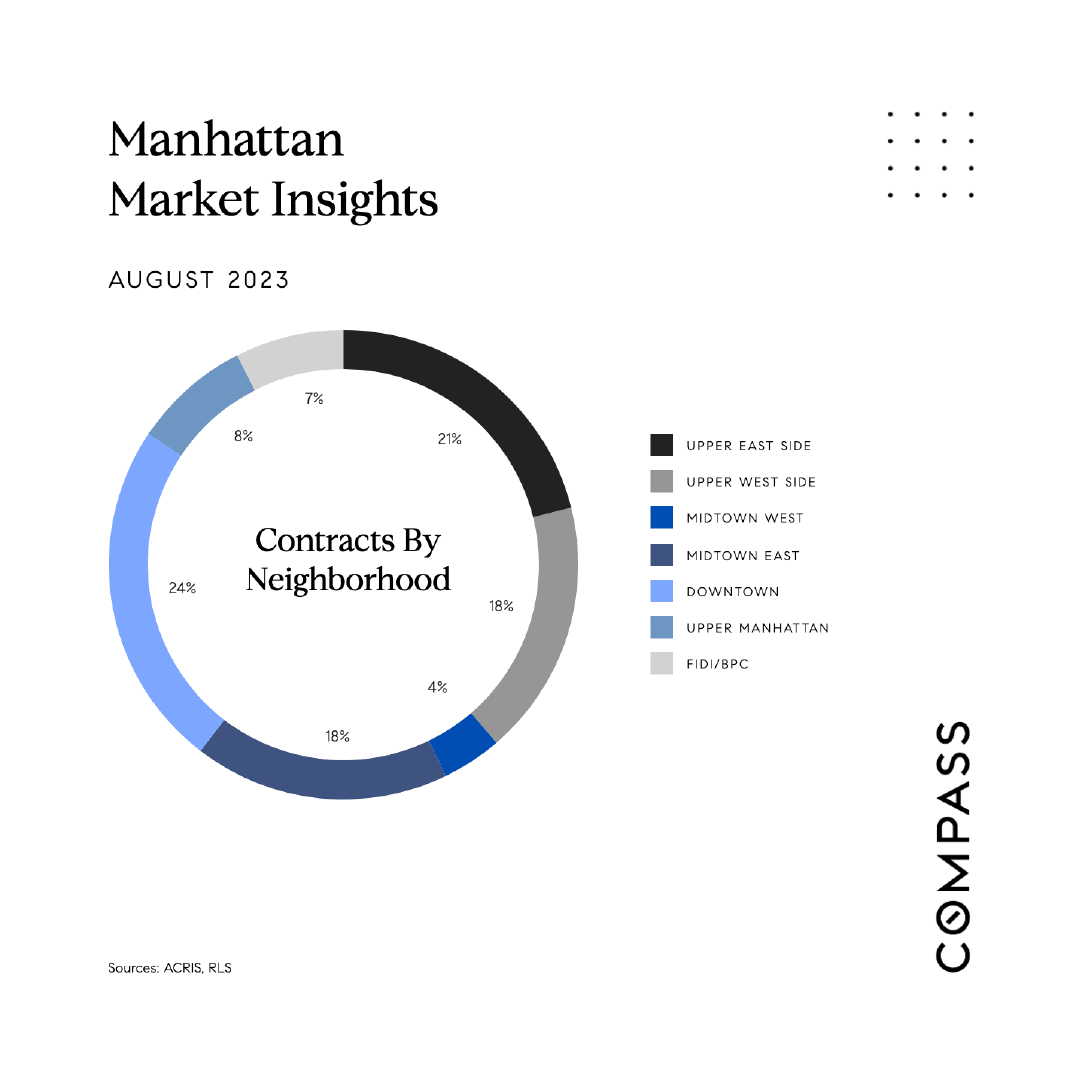
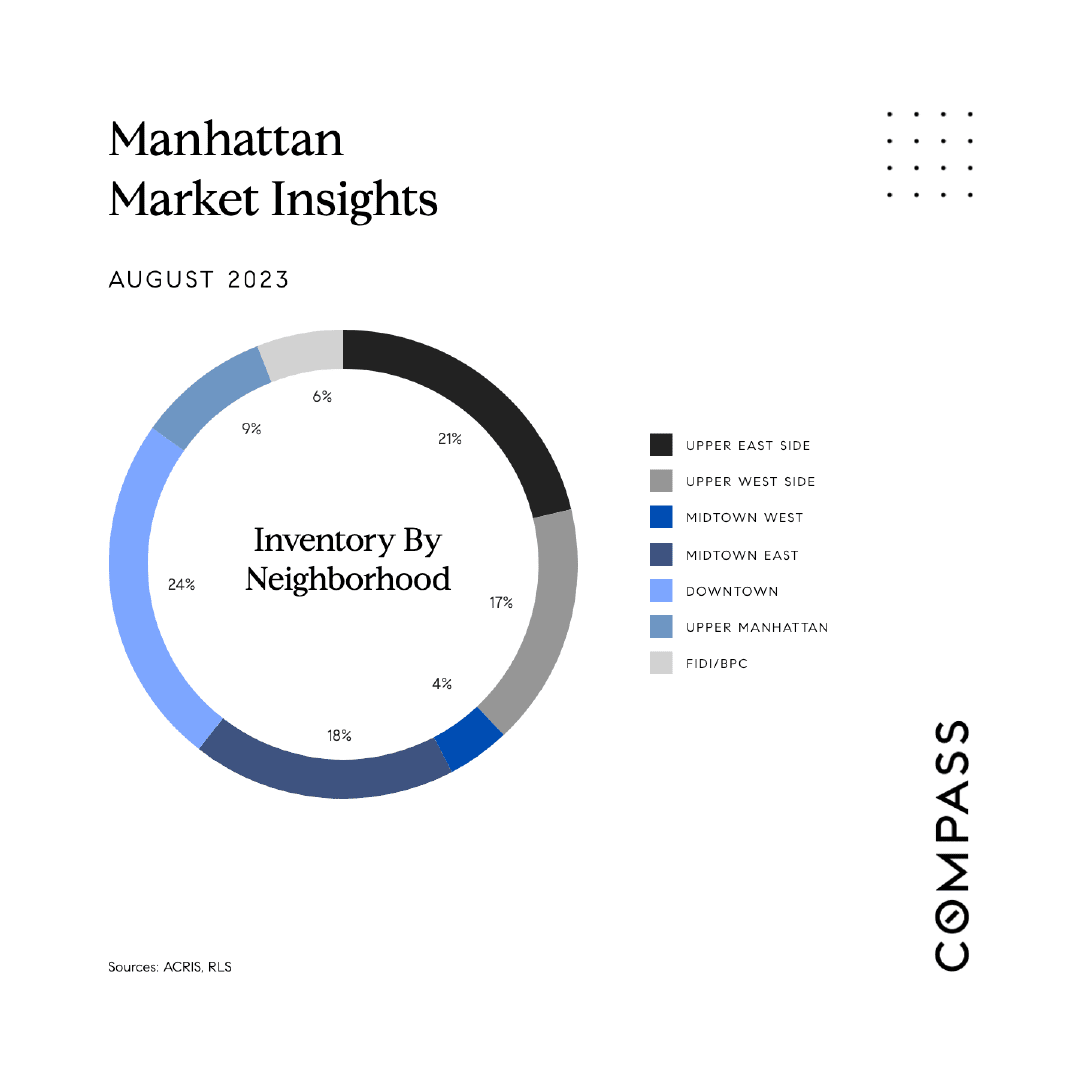
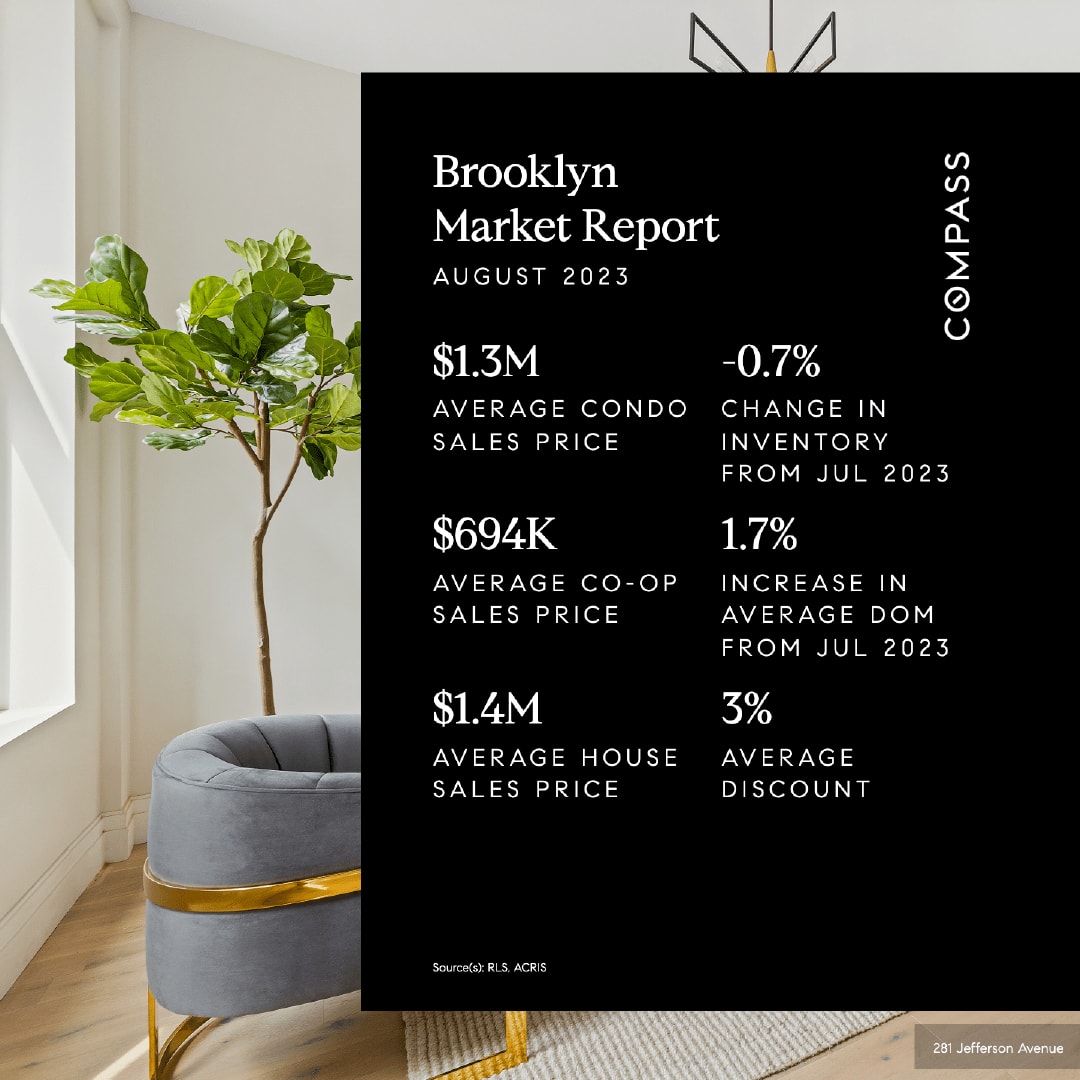
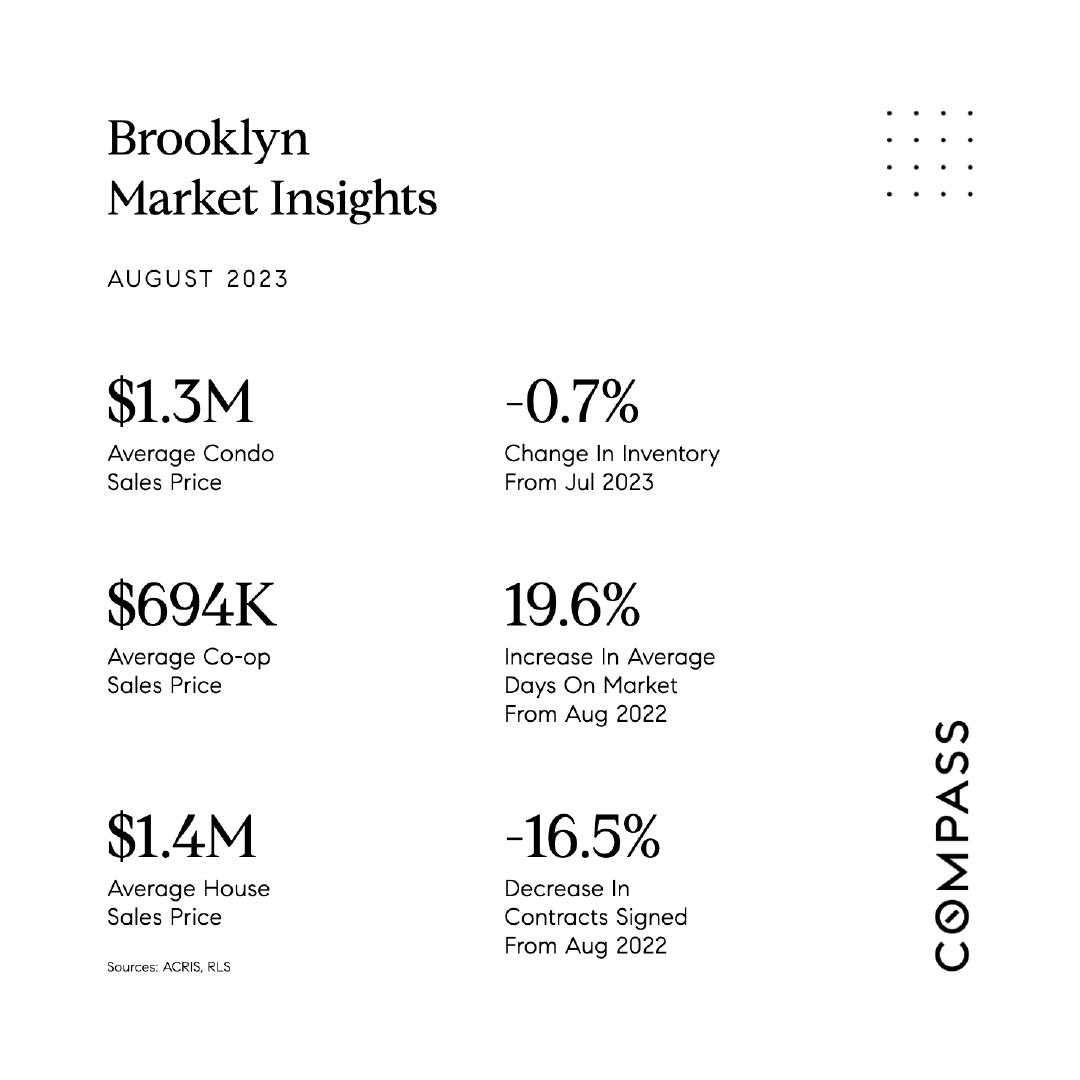
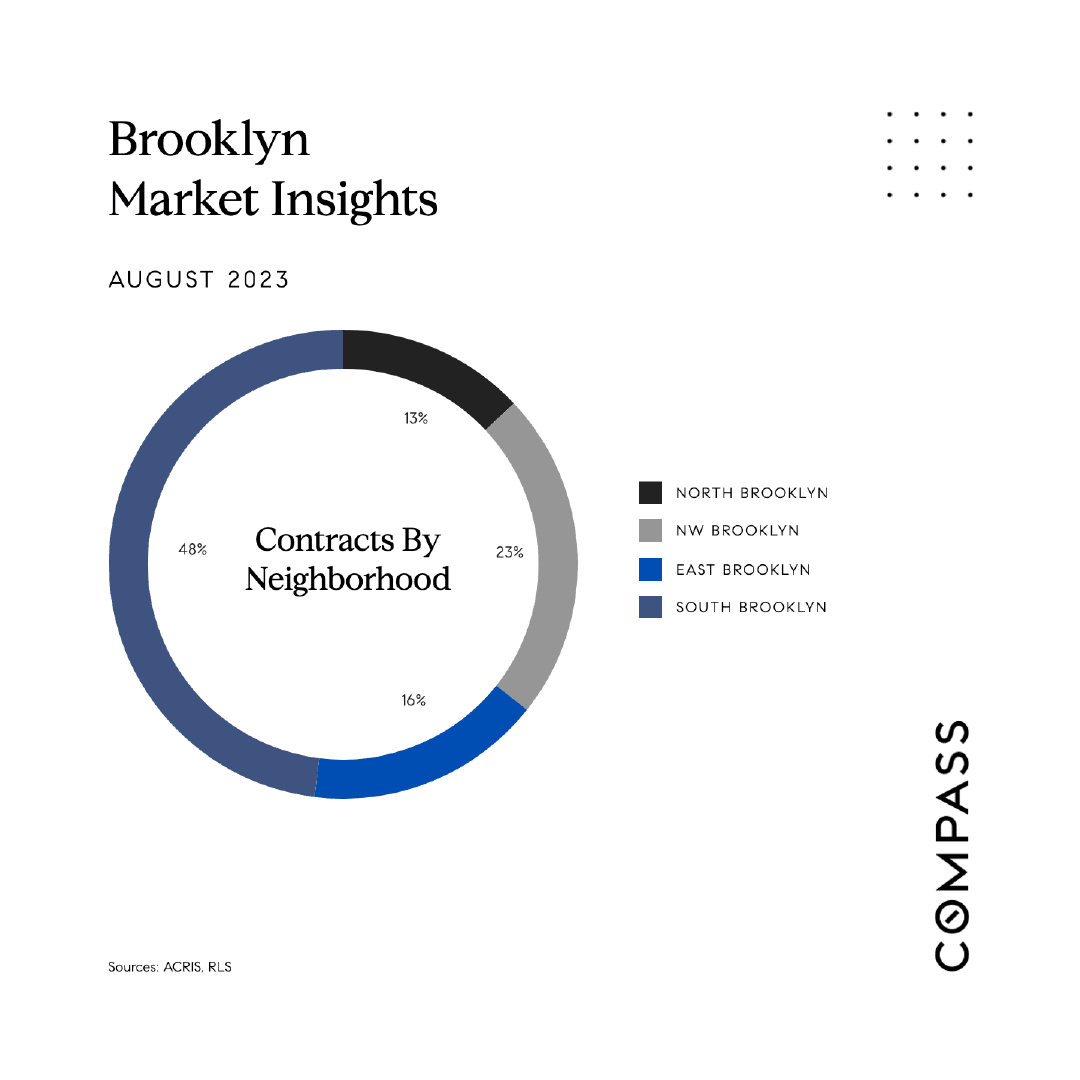
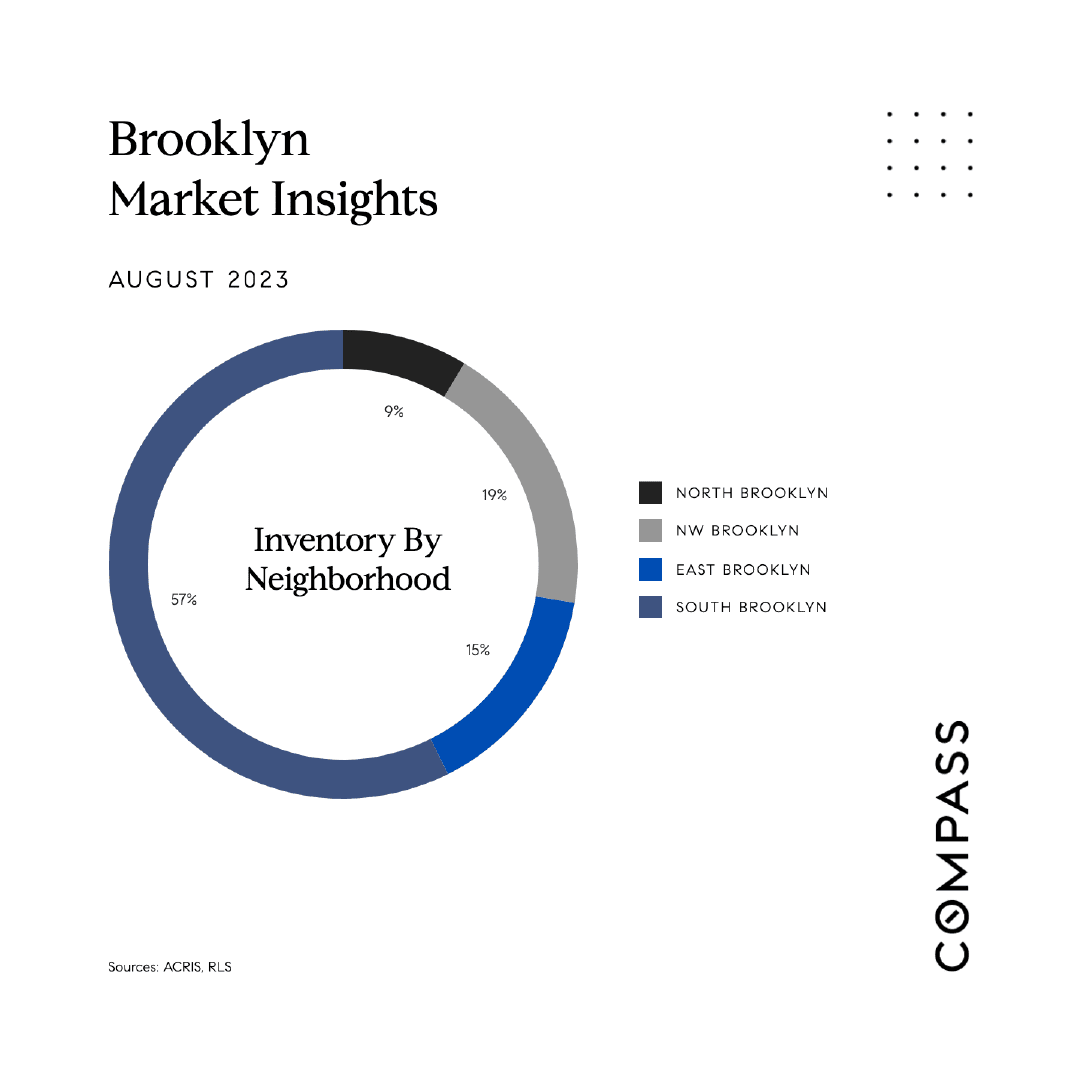
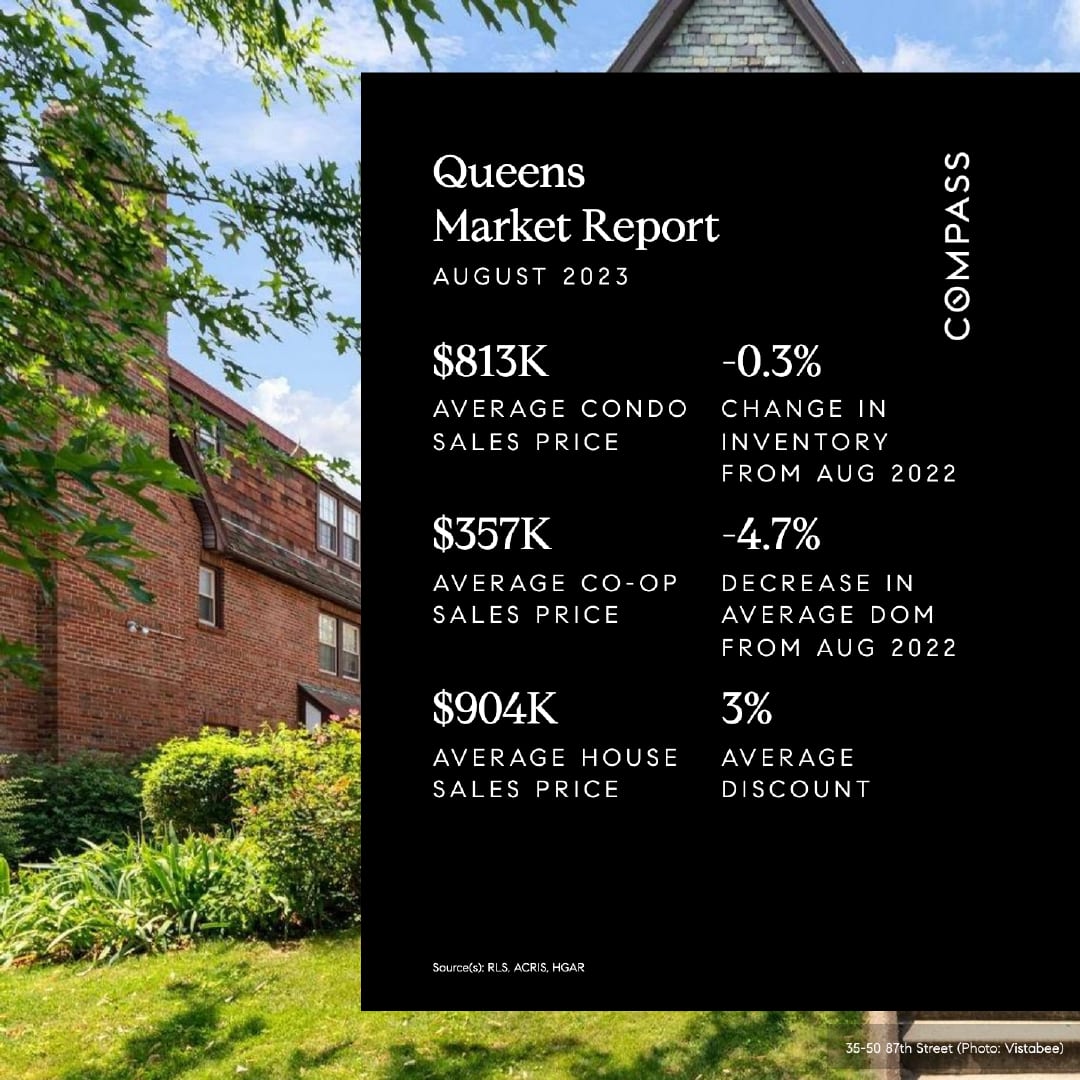
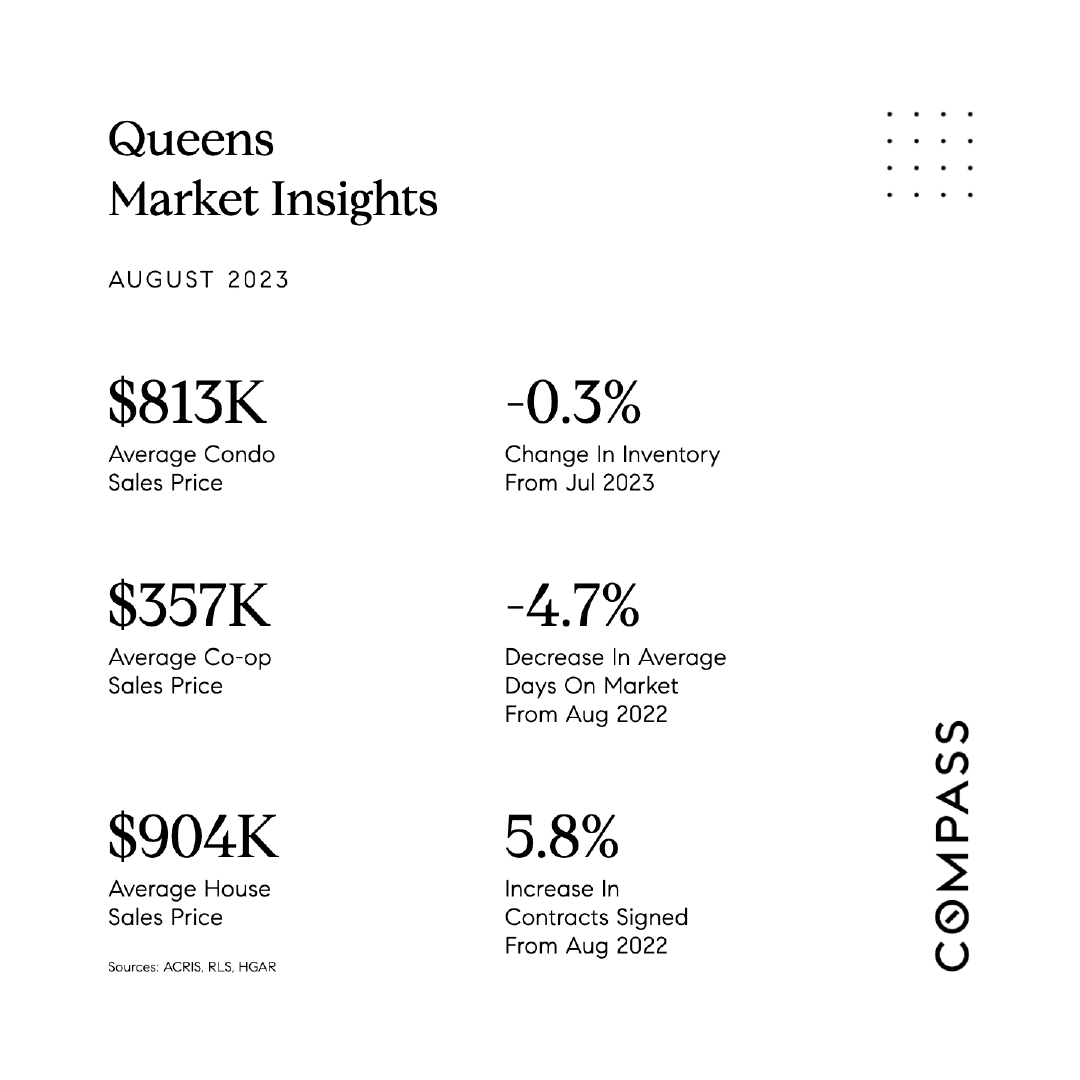
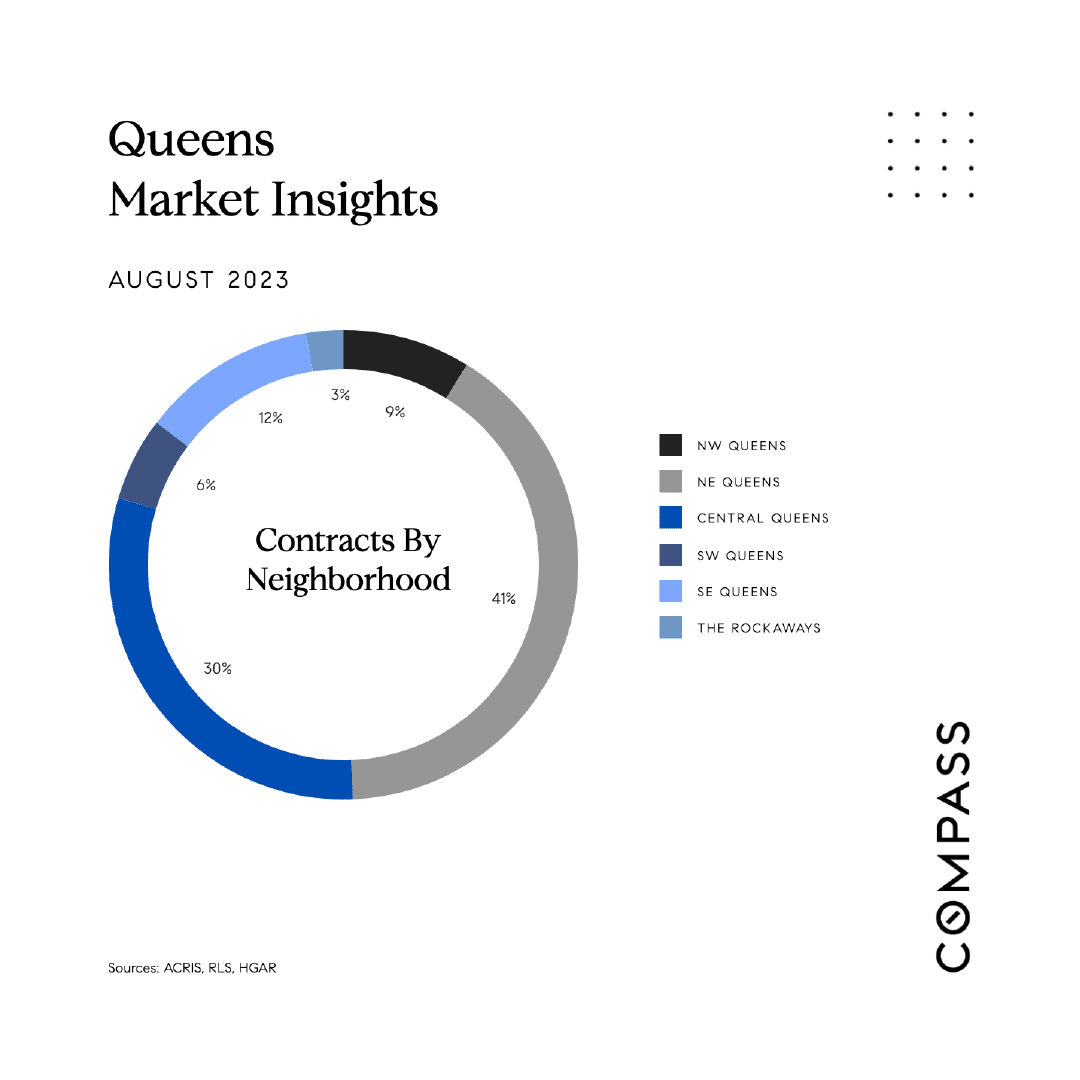
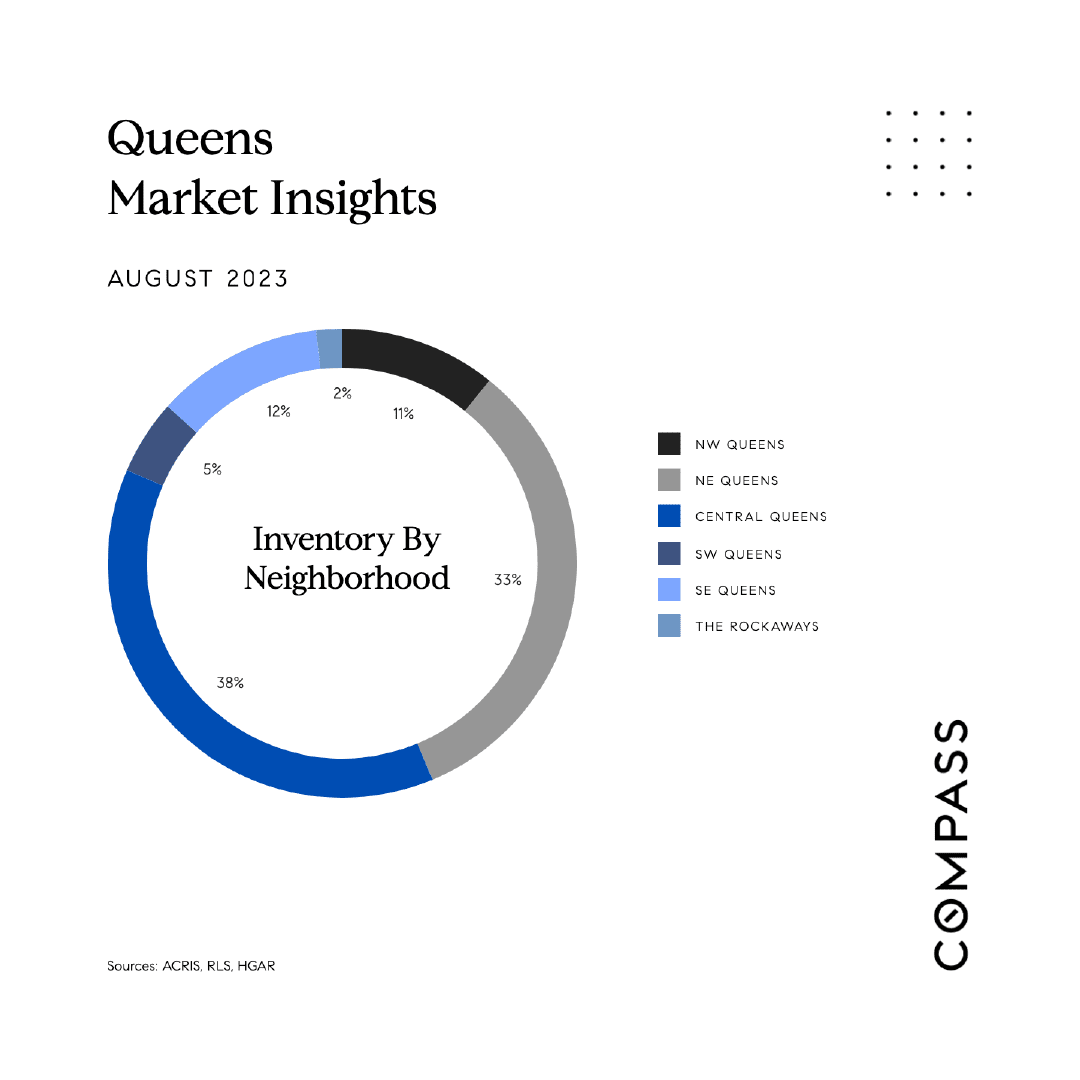
Manhattan August 2023 market report with condo and co-op prices, inventory change, and average discount.Manhattan August 2023 market statistics for condo and co-op prices, inventory, and days on market.August 2023 Manhattan contracts-by-neighborhood chart, with Downtown at 24% and Upper East Side at 21%.August 2023 Manhattan inventory by neighborhood, shown in a donut chart with seven neighborhood shares.Brooklyn August 2023 market report: average condo, co-op, and house prices, inventory and days-on-market changes, and average discount.Brooklyn August 2023 market infographic: home sale prices, inventory, days on market, and contracts signed.Brooklyn August 2023 contracts by neighborhood, shown in a donut chart with South Brooklyn leading at 48%.August 2023 Brooklyn inventory by neighborhood: South Brooklyn 57%, Northwest 19%, East 15%, North 9%.Queens August 2023 market report with condo, co-op, and house prices and inventory trends.Queens August 2023 market insights: condo, co-op, and house prices, inventory, days on market, and contracts signed.August 2023 Queens contracts by neighborhood: NE Queens 41%, Central Queens 30%, SE Queens 12%, NW Queens 9%, SW Queens 6%, Rockaways 3%.August 2023 Queens inventory chart: Central Queens 38%, Northeast Queens 33%, Southeast Queens 12%, Northwest Queens 11%, Southwest Queens 5%, Rockaways 2%.