
Thrive Real Estate Team at Compass

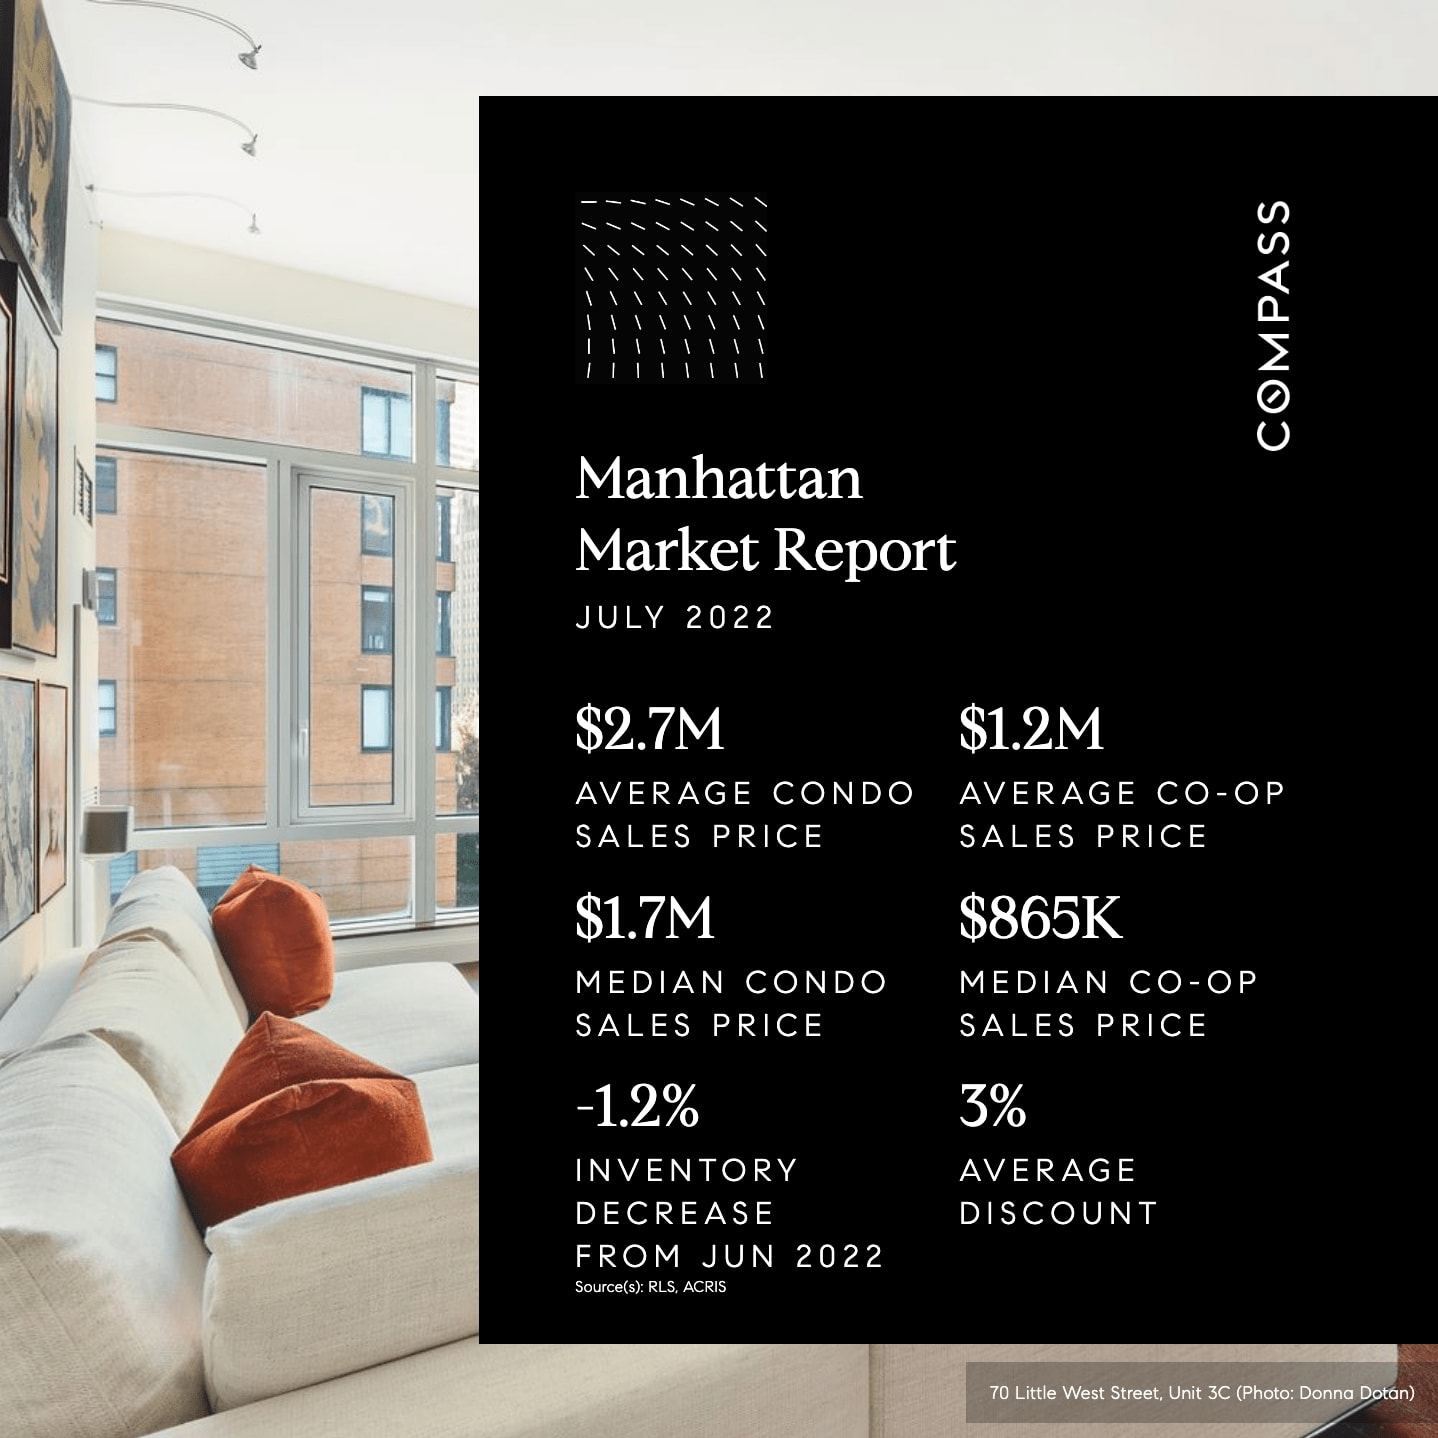
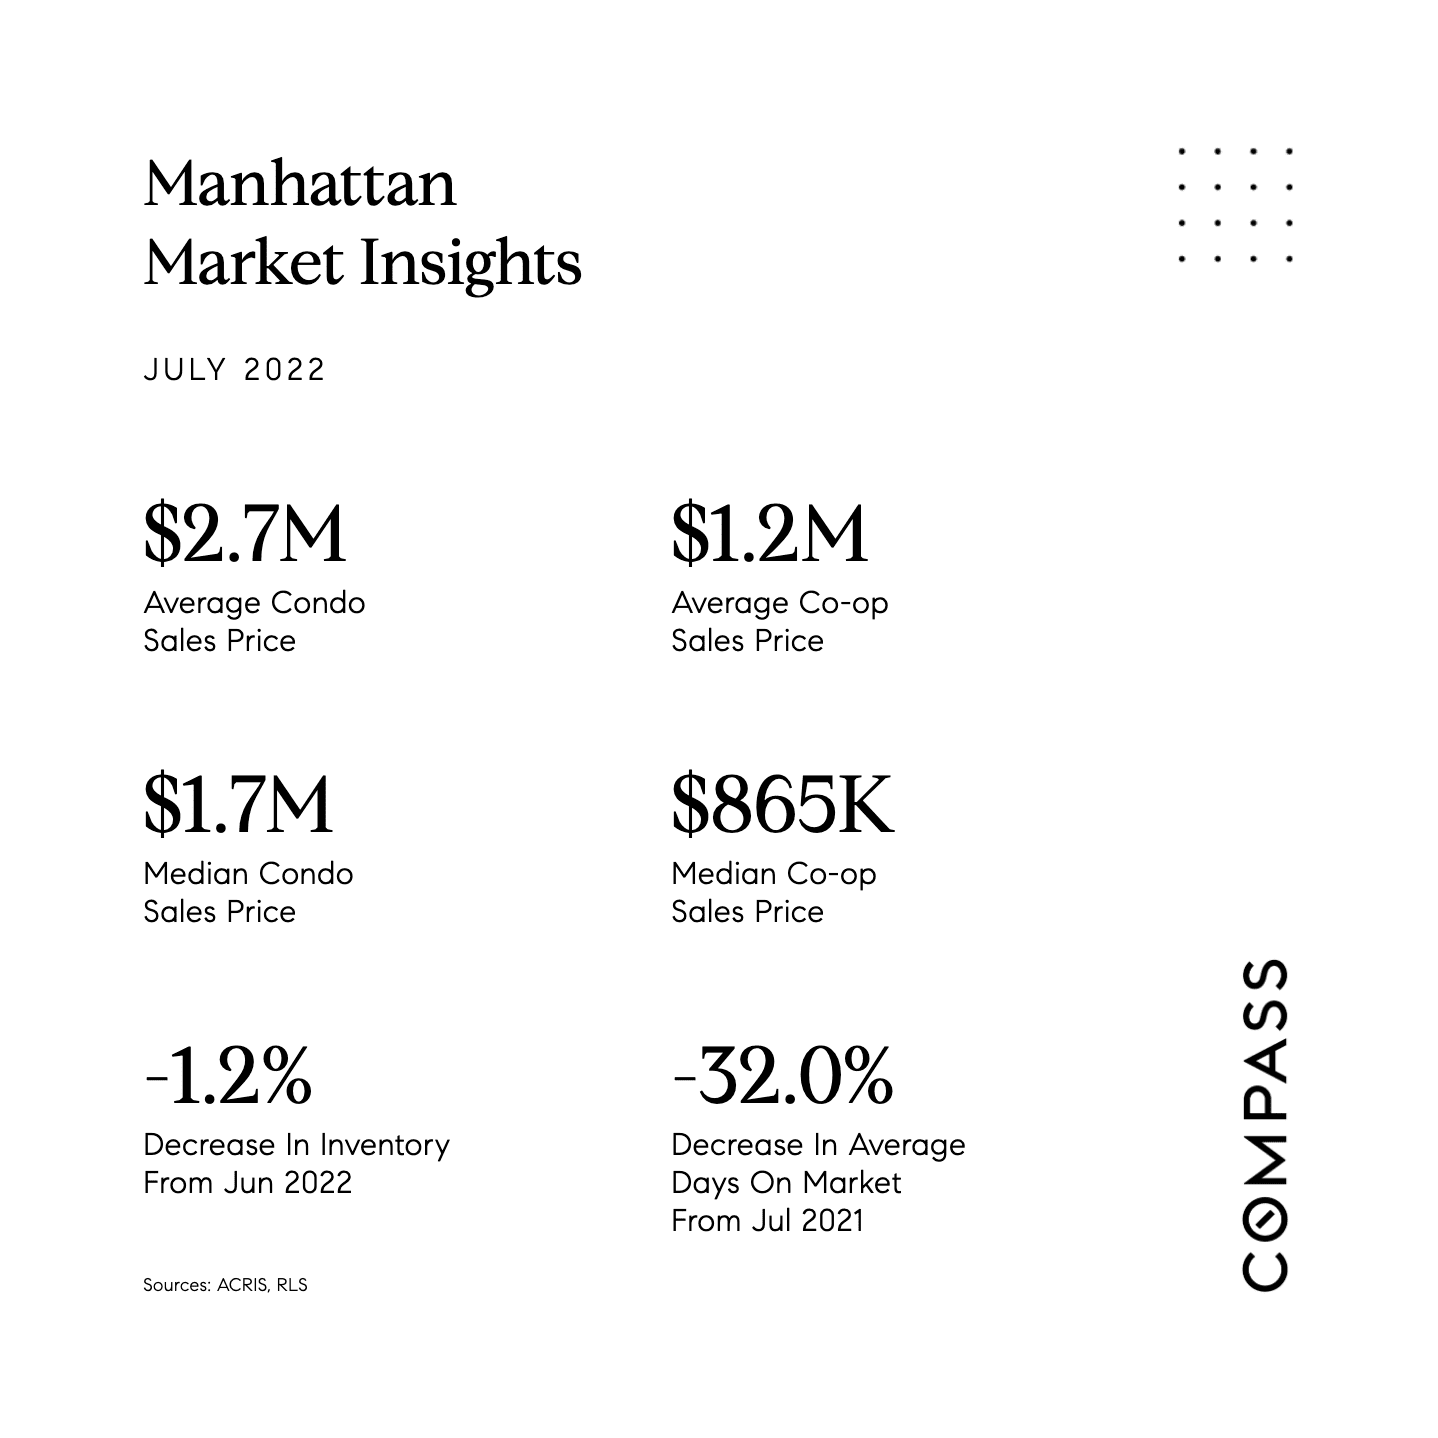
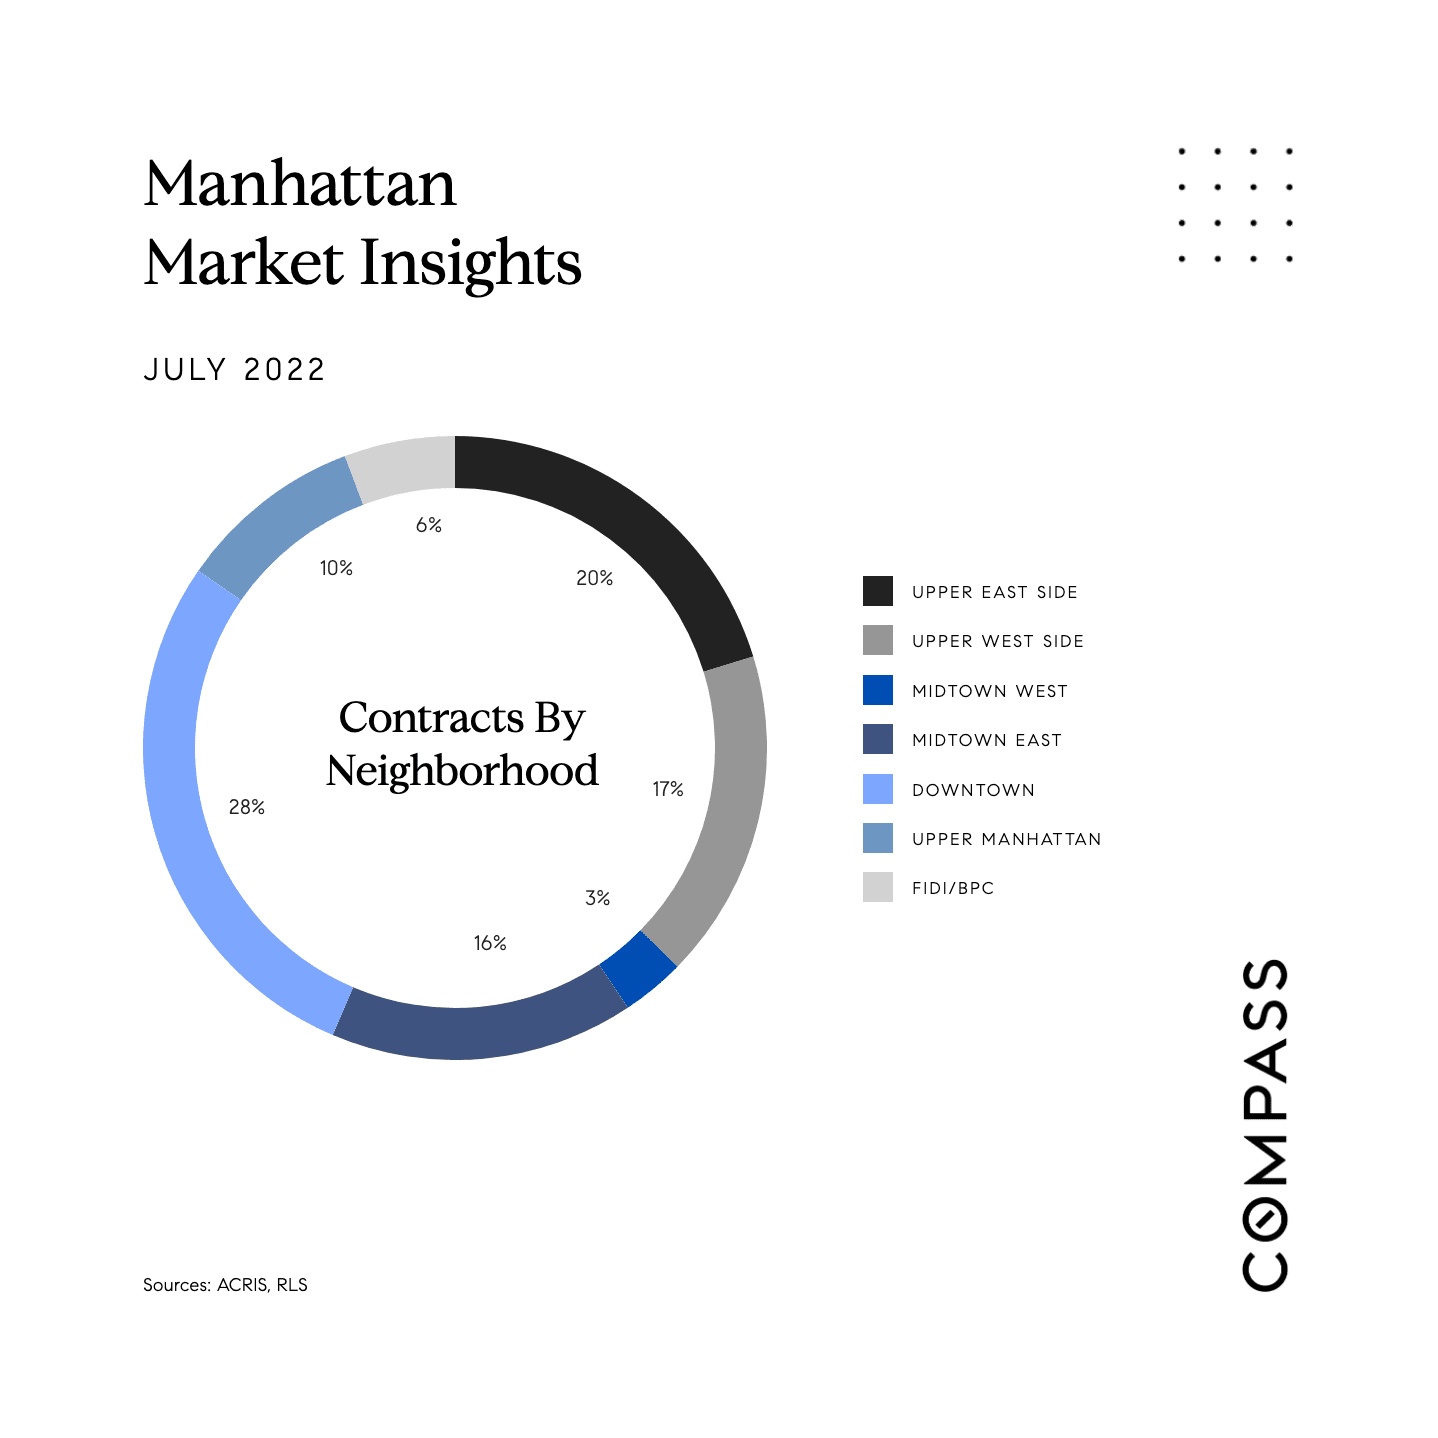
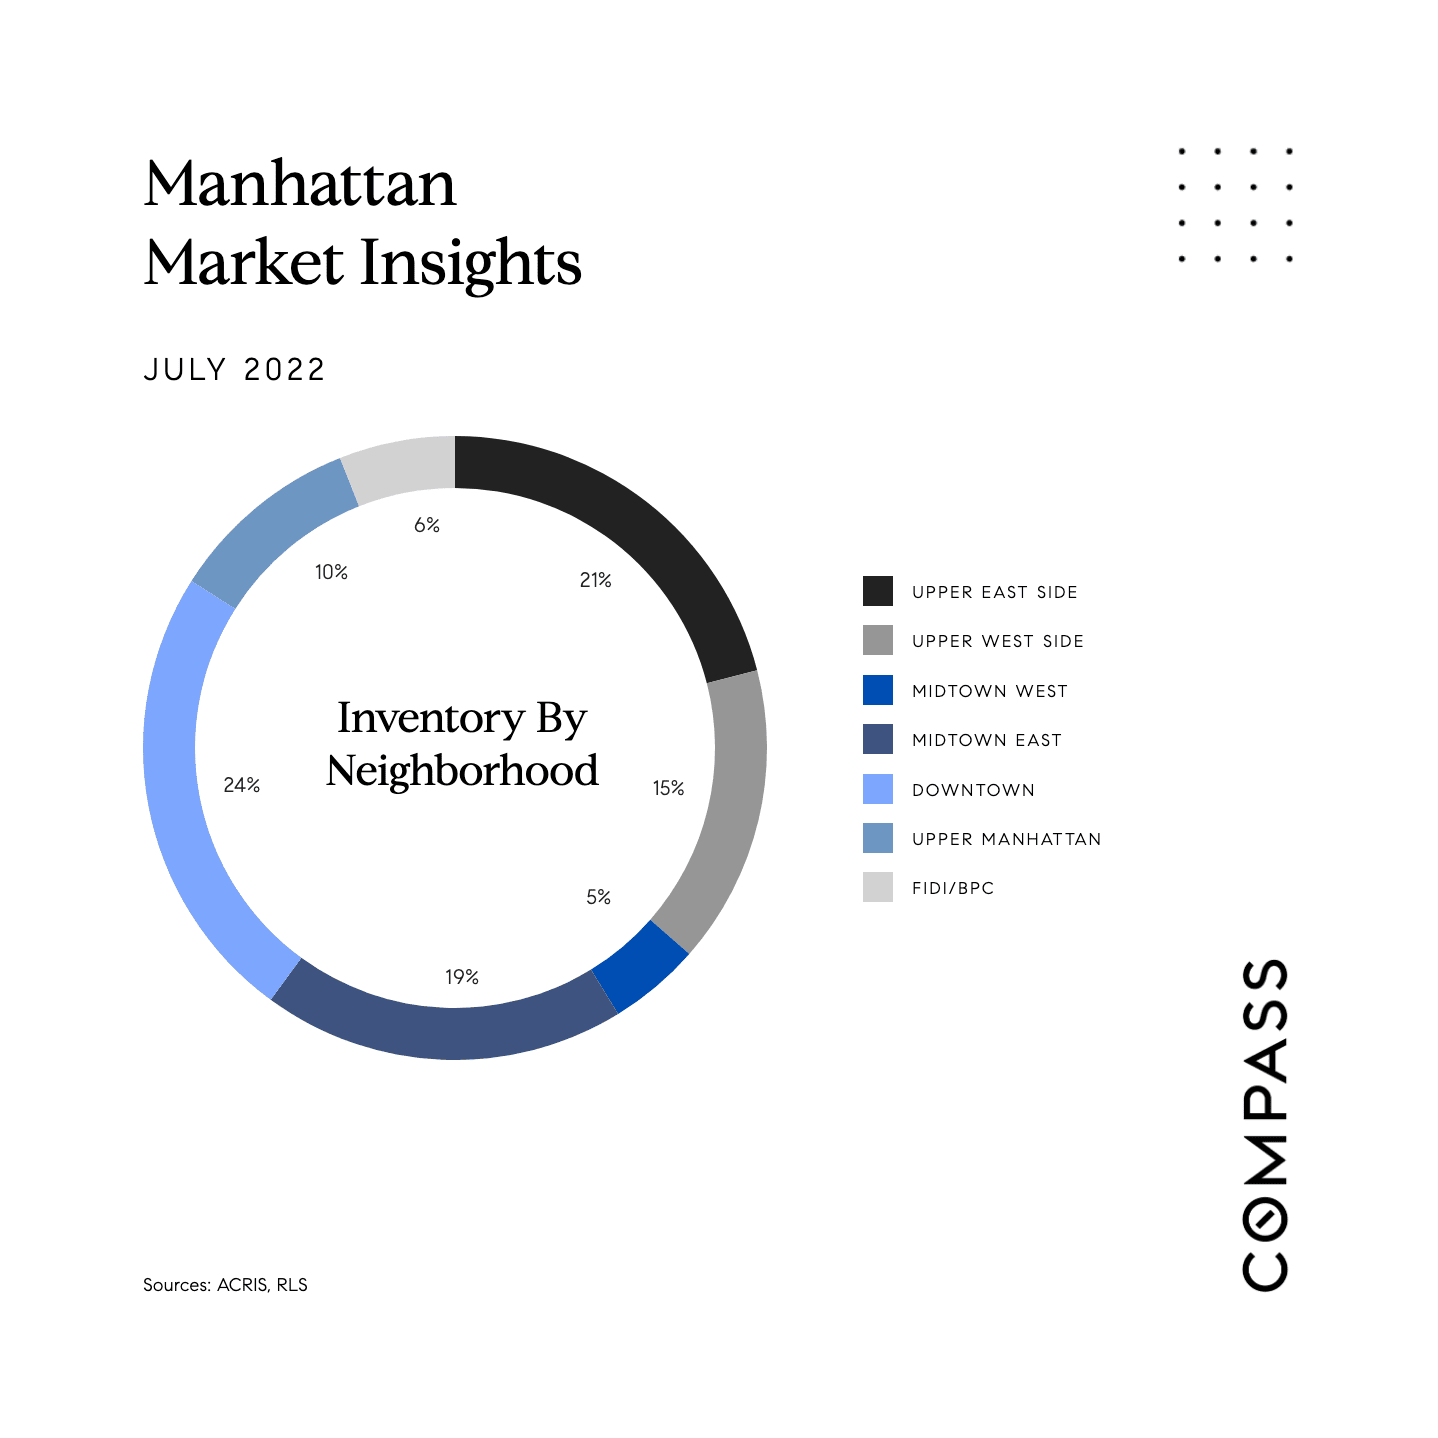
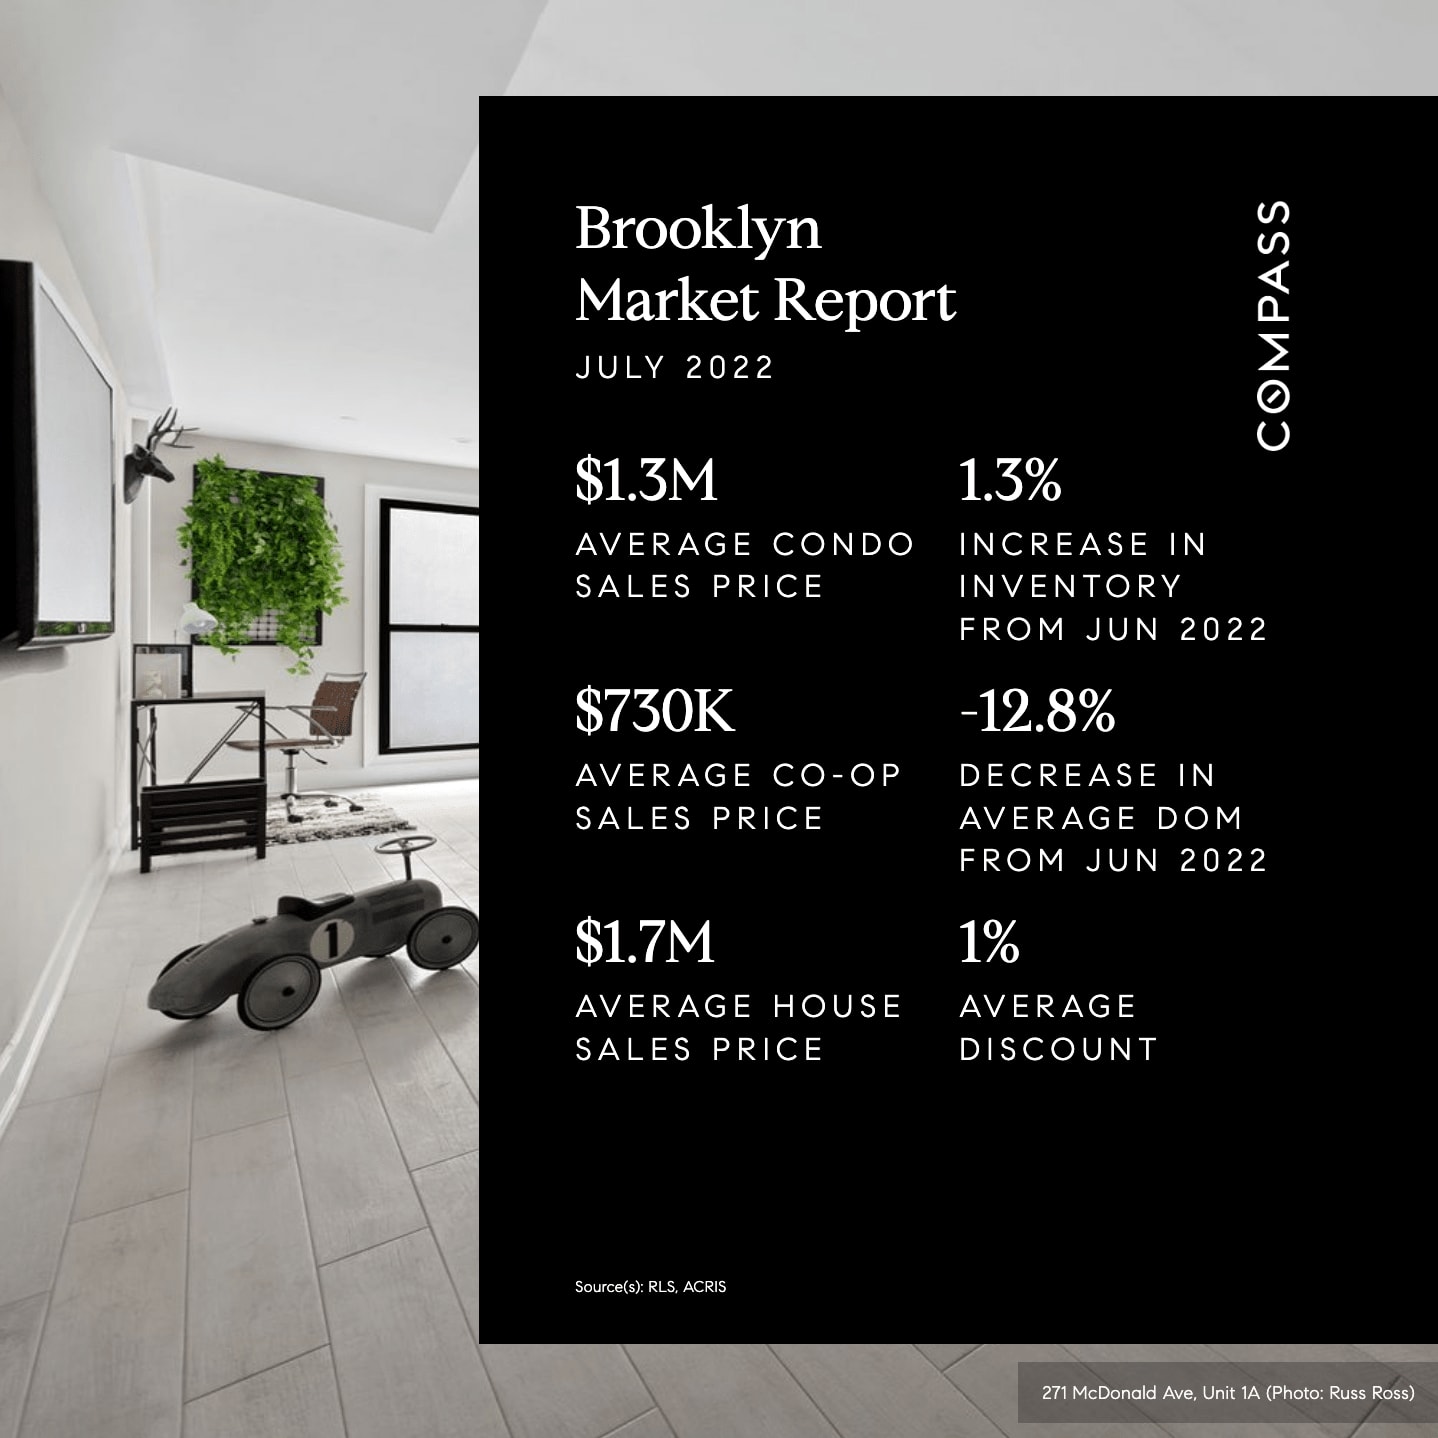
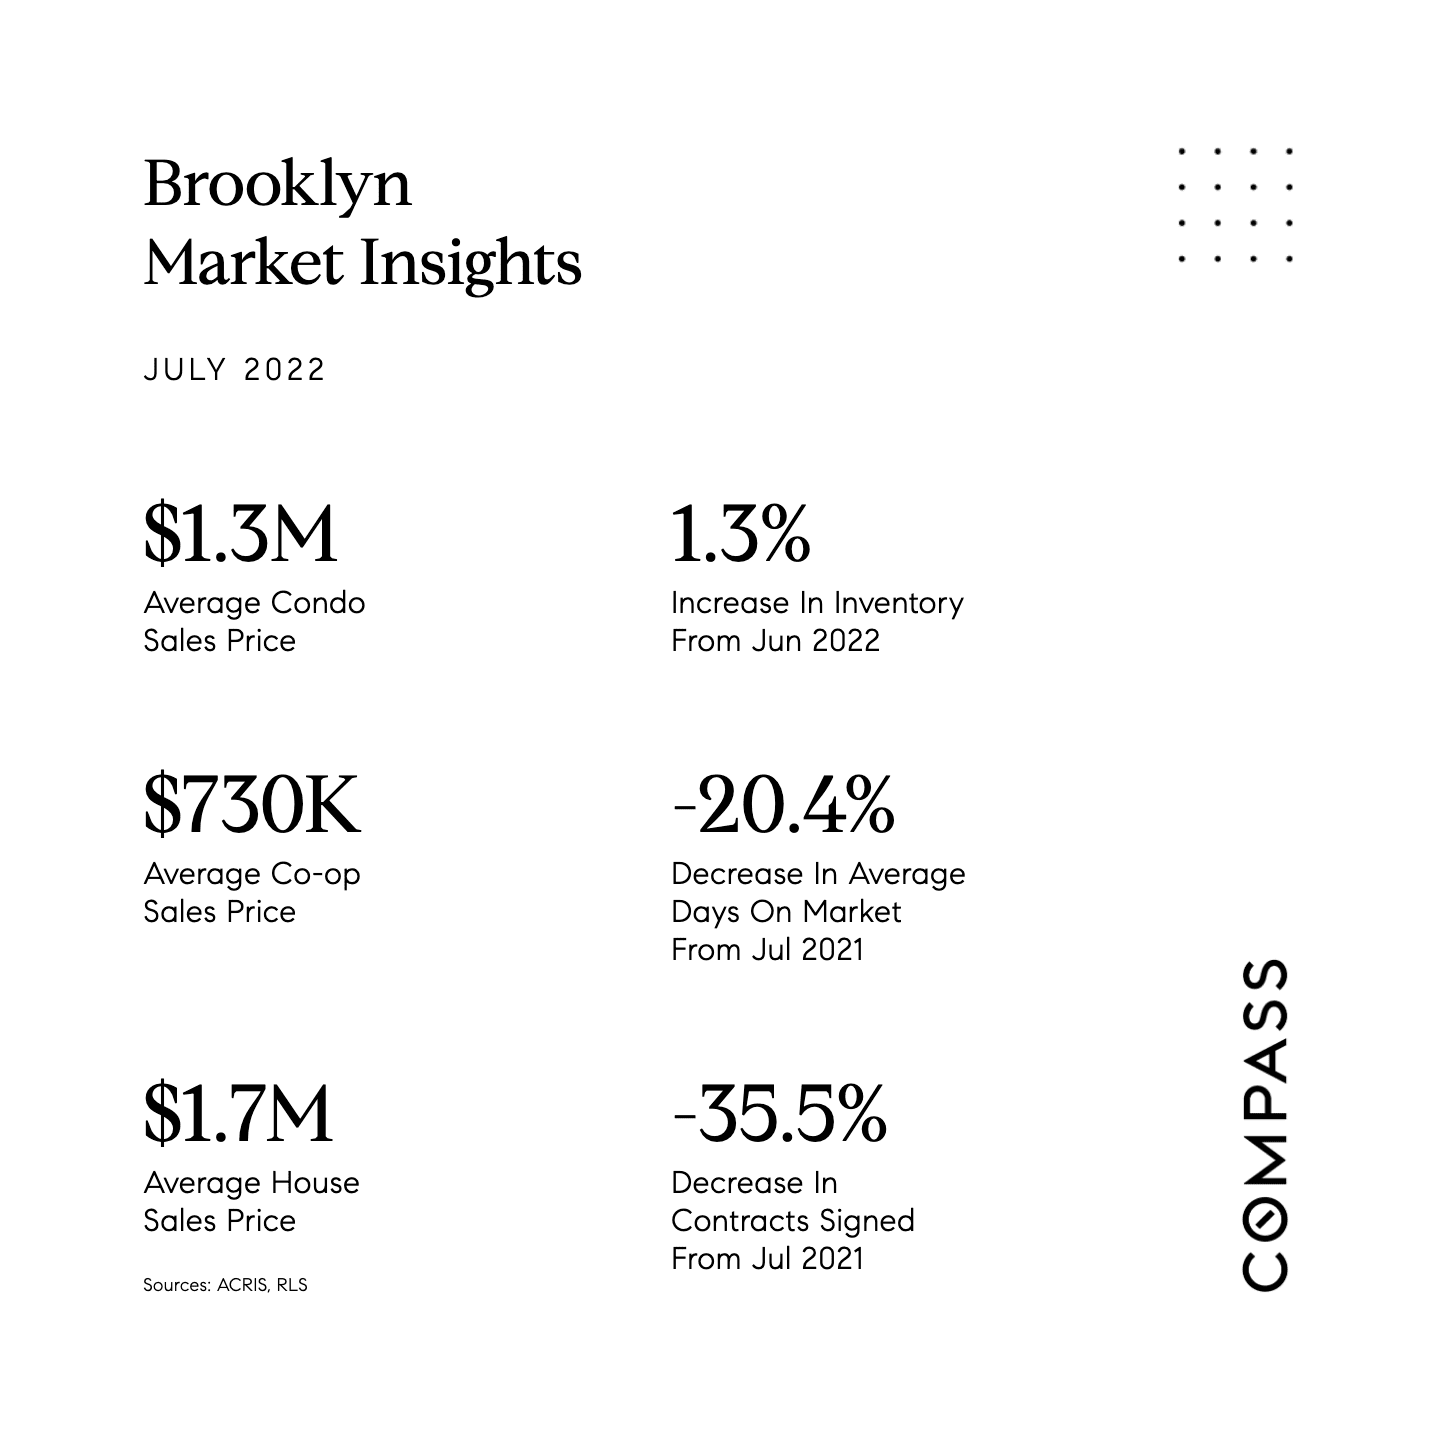
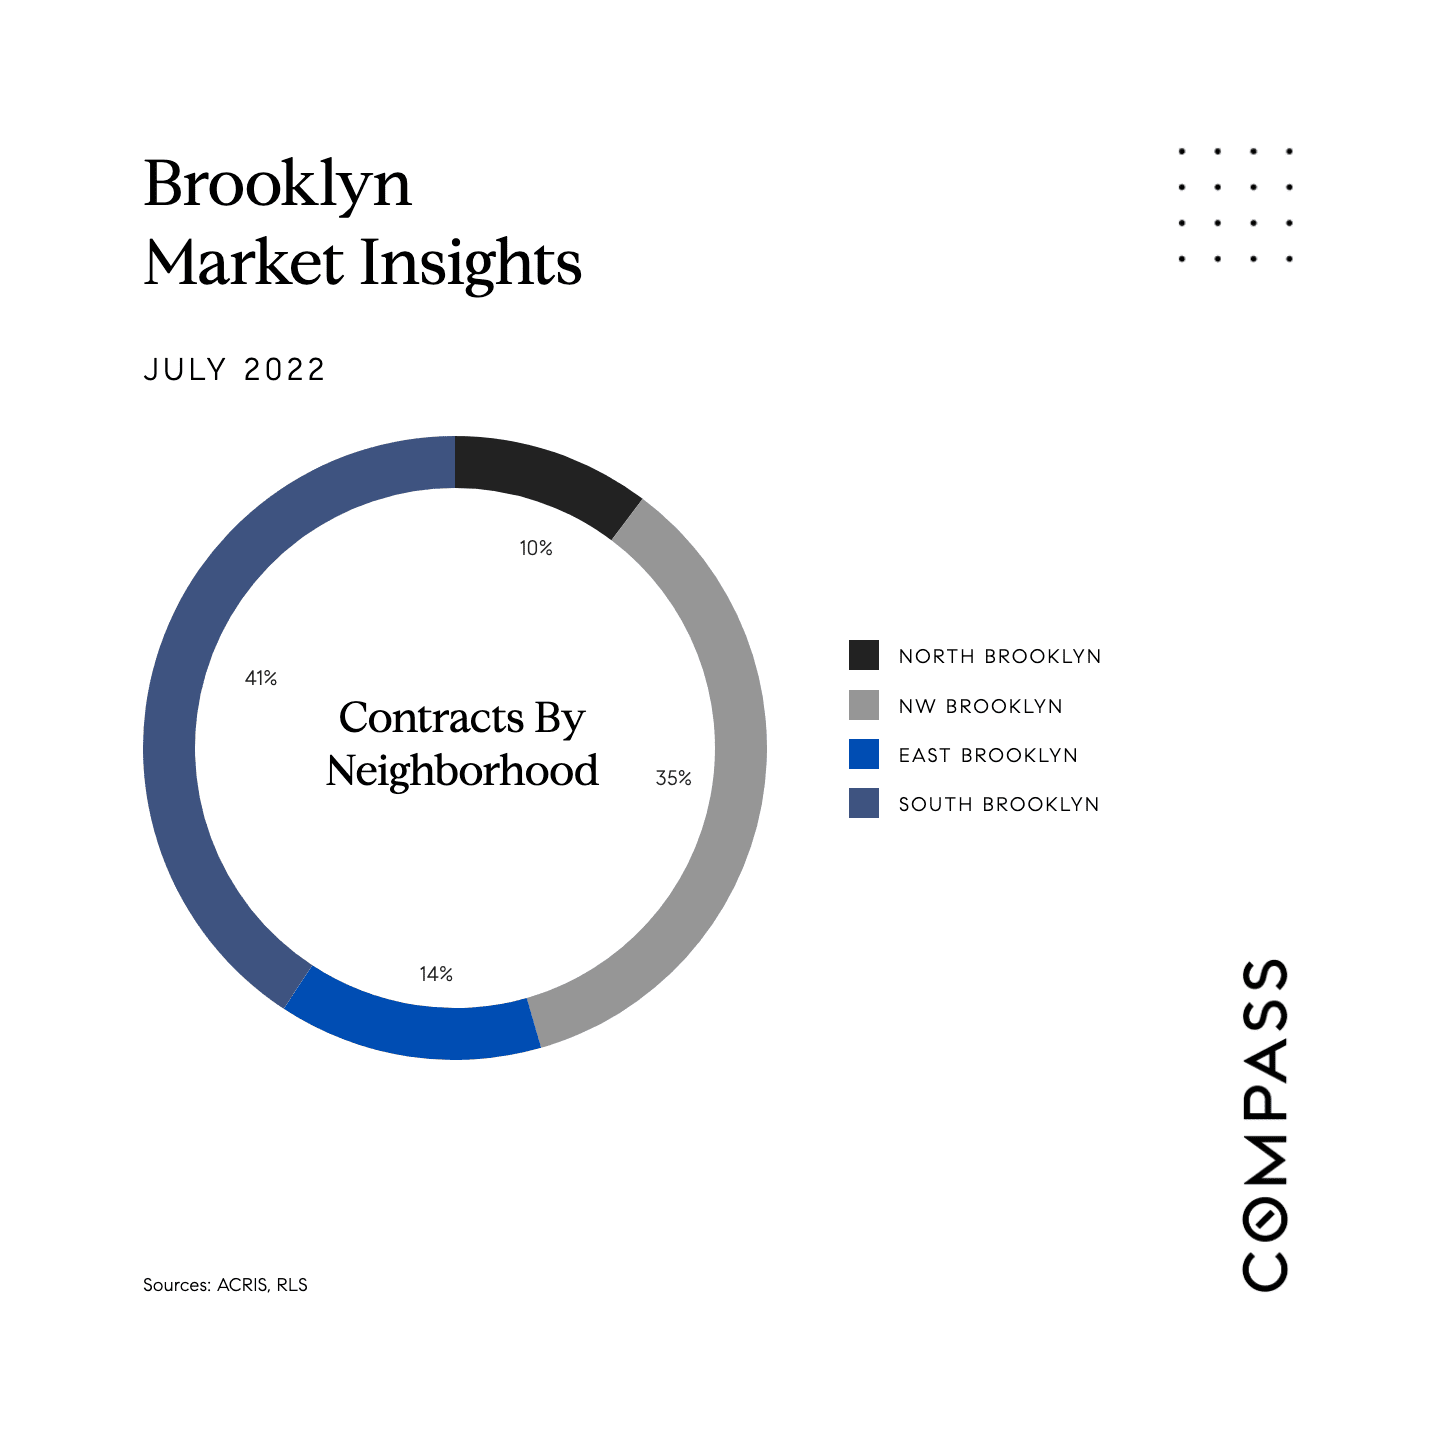
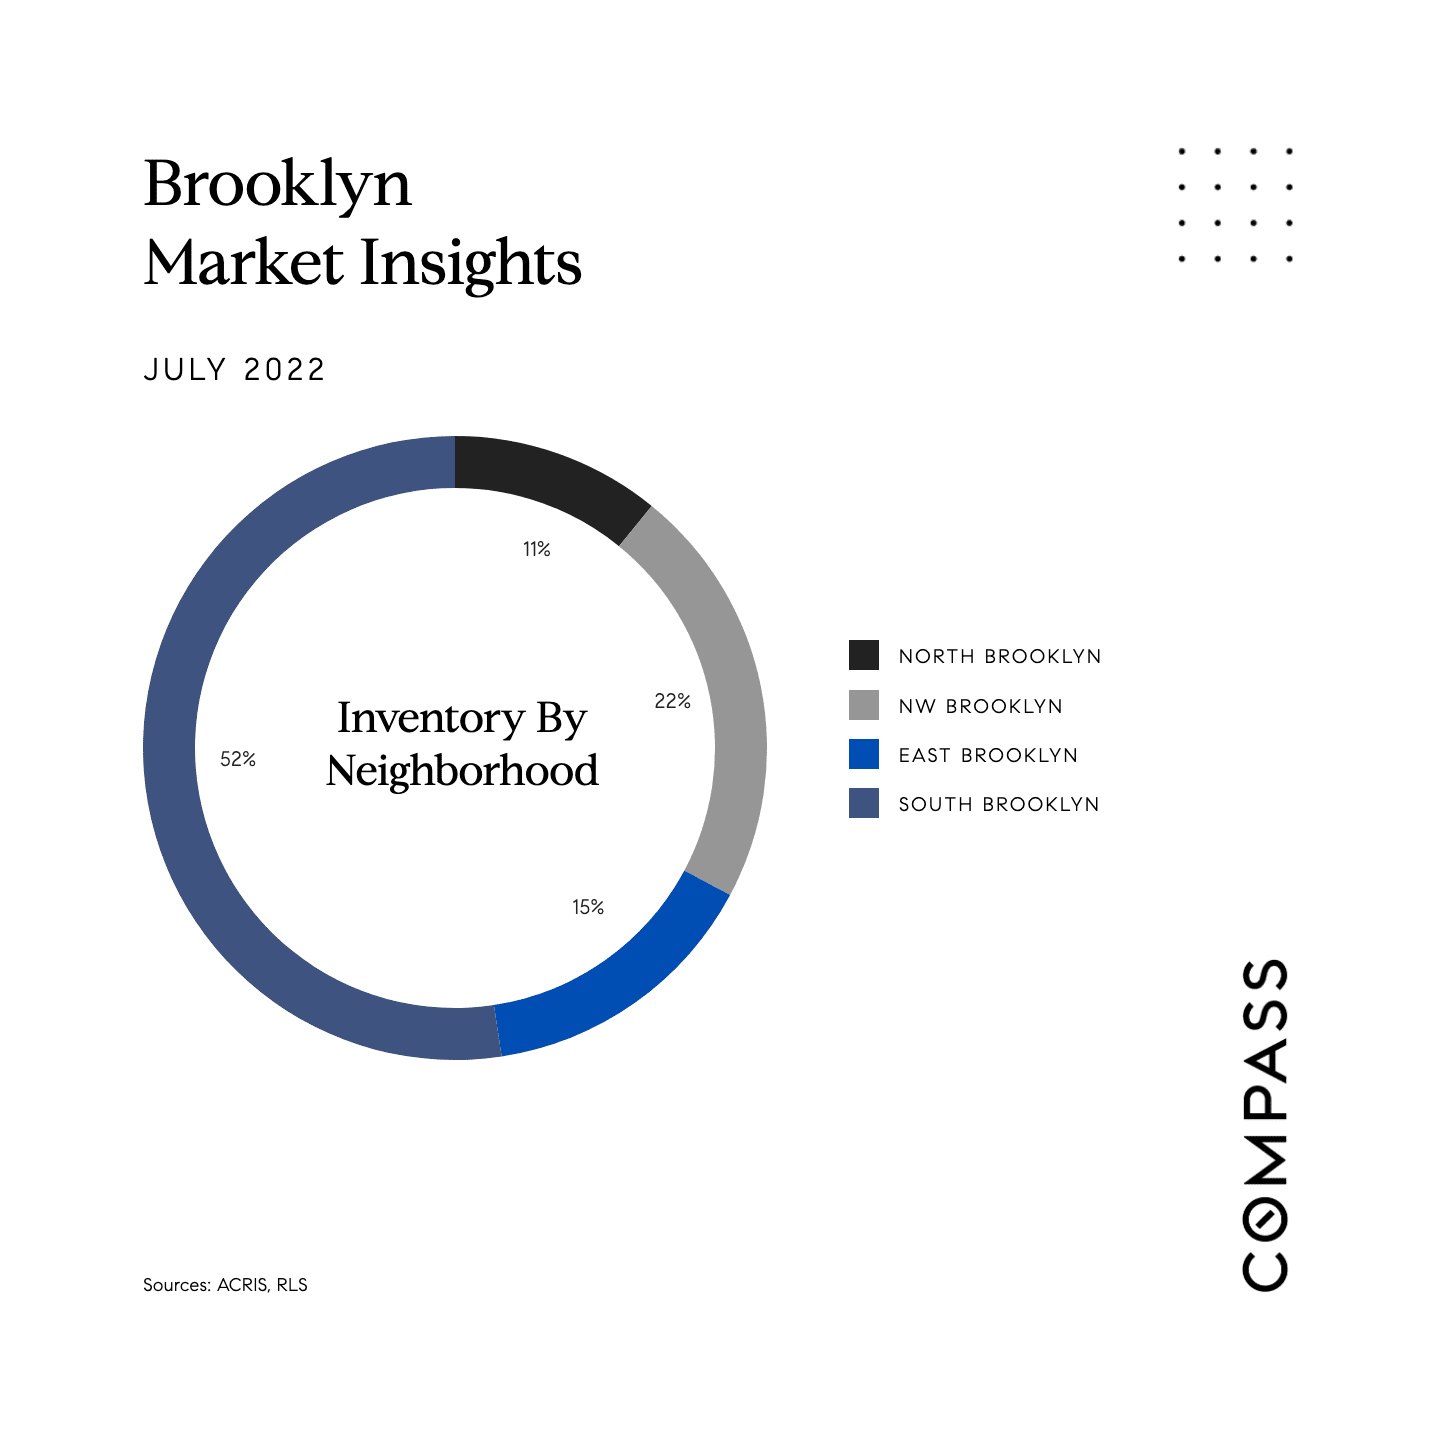
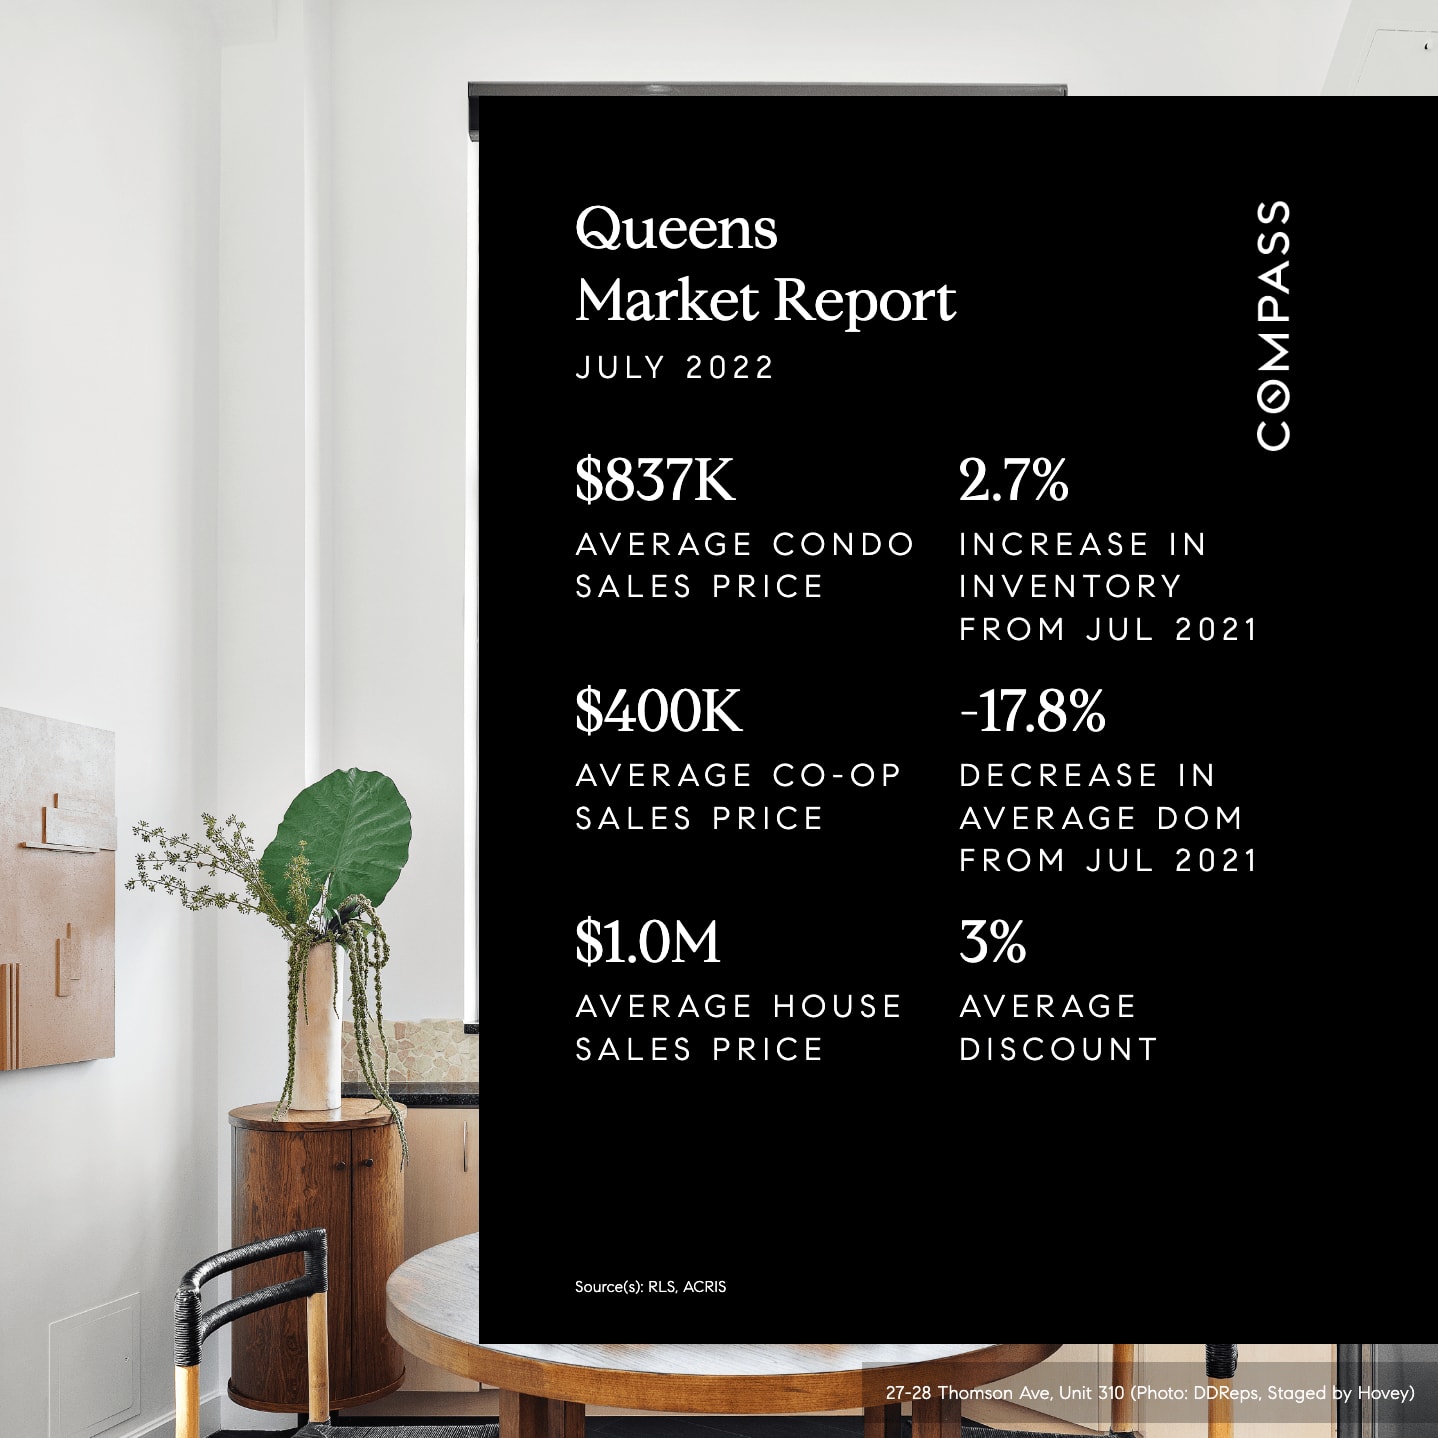
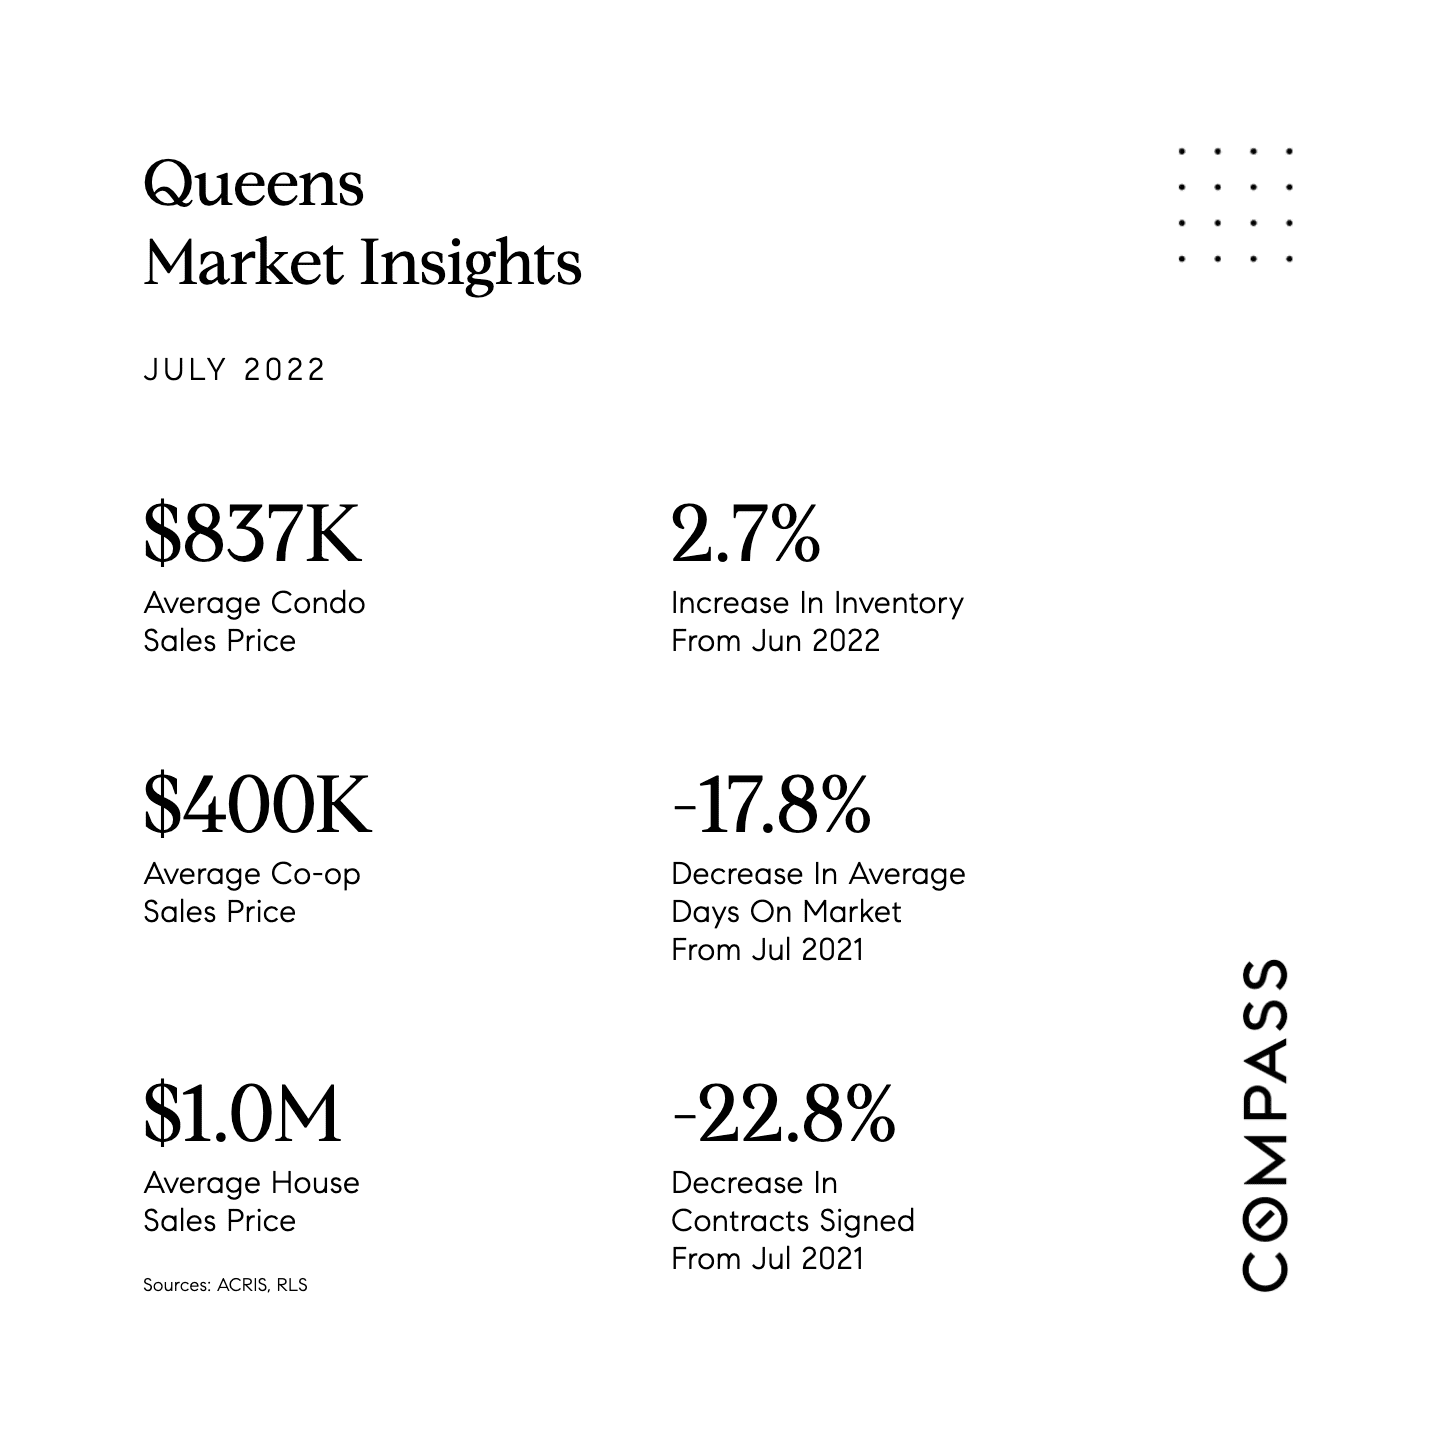
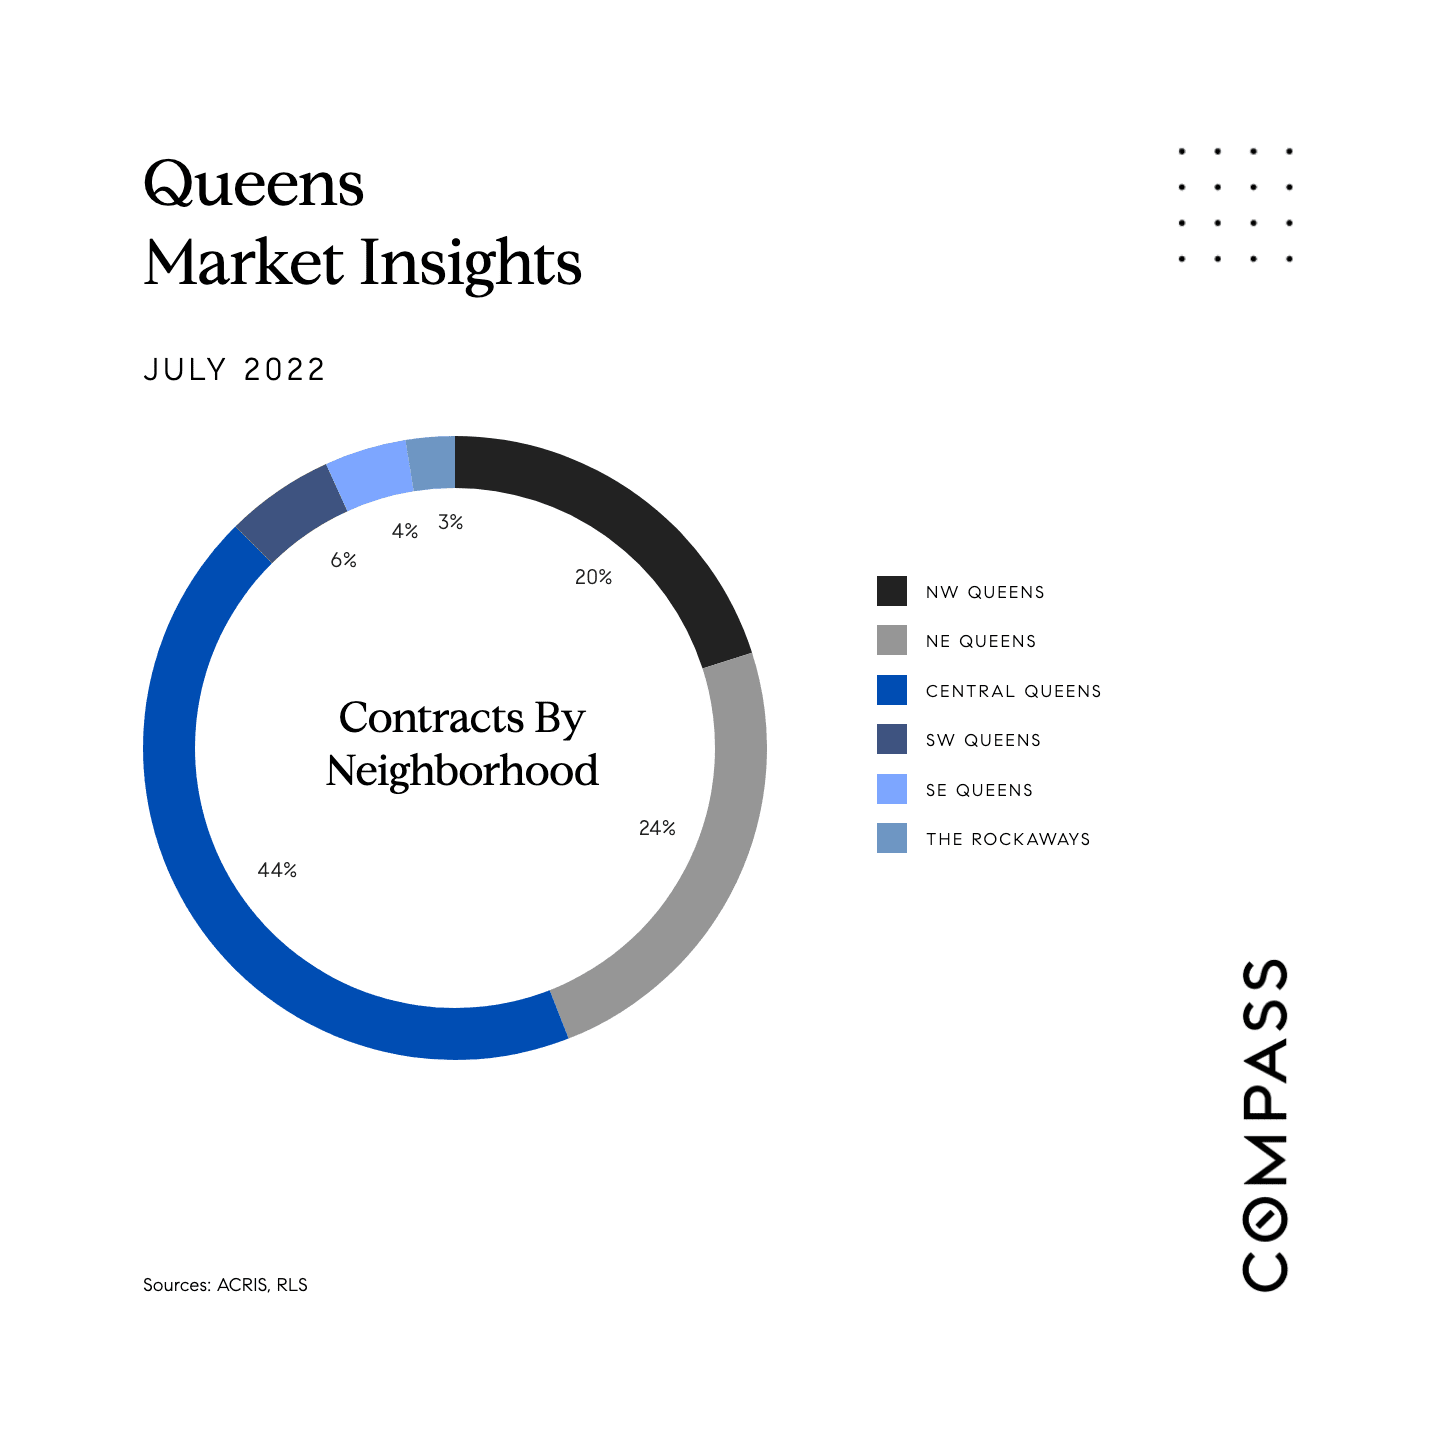
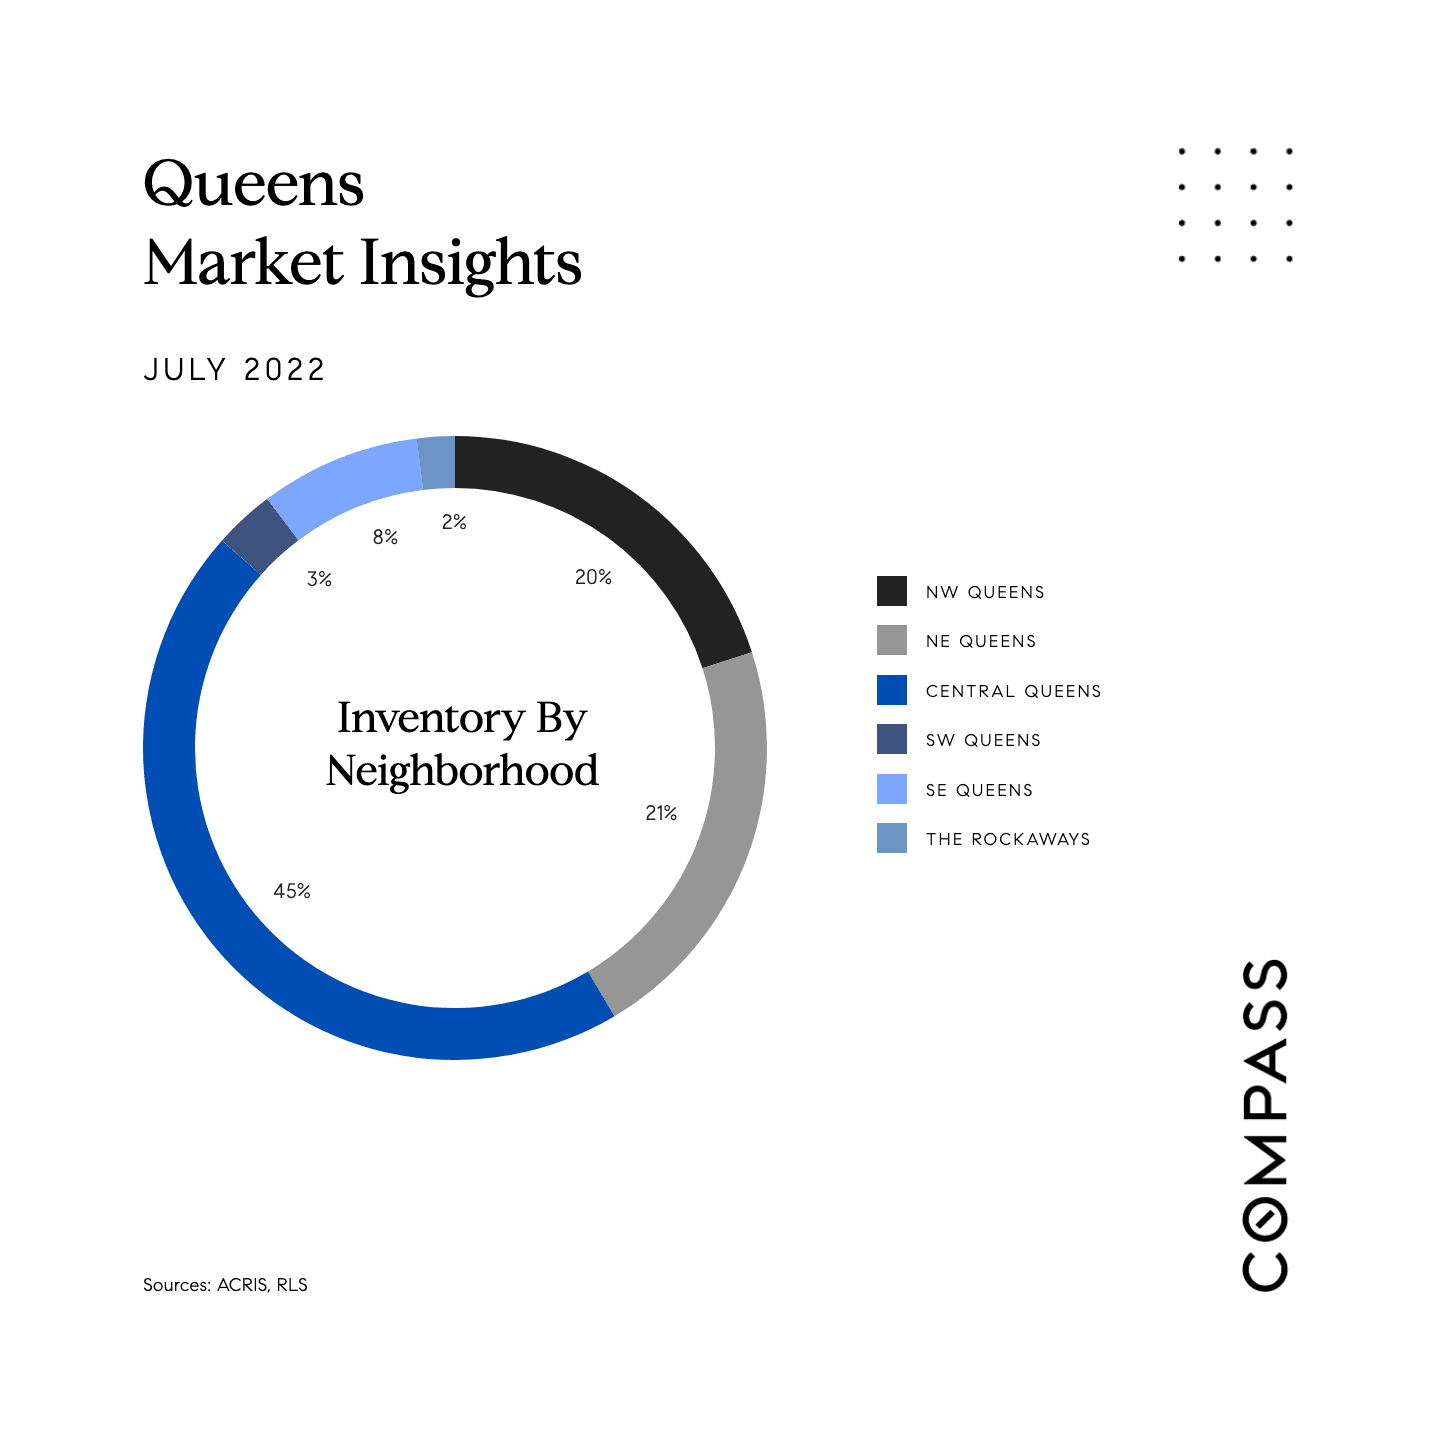
July 2022 Manhattan market report: condo and co-op sale prices, inventory decrease, and average discount.Manhattan July 2022 market snapshot with condo and co-op prices, inventory, and days-on-market changes.July 2022 Manhattan contracts by neighborhood: Downtown 28%, Upper East Side 20%, Upper West Side 17%, Midtown East 16%, Upper Manhattan 10%, FIDI/BPC 6%, Midtown West 3%.July 2022 Manhattan inventory by neighborhood, shown as a donut chart with percentage shares.Brooklyn July 2022 market report with home prices, inventory, days on market, and discount statistics.Brooklyn July 2022 market snapshot: condo $1.3M, co-op $730K, house $1.7M; inventory up 1.3%.July 2022 Brooklyn contracts by neighborhood: South 41%, NW 35%, East 14%, and North 10%.July 2022 Brooklyn inventory by neighborhood: South Brooklyn 52%, Northwest Brooklyn 22%, East Brooklyn 15%, North Brooklyn 11%.July 2022 Queens market report: average home prices, inventory change, days on market, and average discount.Queens July 2022 market snapshot: average home prices, inventory, days on market, and contracts signed.July 2022 Queens contracts by neighborhood chart: Central Queens 44%, NE Queens 24%, NW Queens 20%, and other areas.Queens July 2022 inventory by neighborhood: Central 45%, NE 21%, NW 20%, SE 8%, SW 3%, Rockaways 2%.