Thrive Real Estate Team at Compass

Hey there! We have exciting news to share with you! 📢🔥 The November 2023 Market Report and the Rental Report are now available, providing you with valuable insights into the real estate market. It's crucial to stay informed about the latest trends and developments, and these reports are here to help you stay in the loop.

In the November 2023 Market Report, you'll find comprehensive analysis and data on the current state of the real estate market. From housing prices to market trends, this report covers it all. Whether you're a buyer, seller, or investor, this report will provide you with the information you need to make informed decisions.

Access the full report Here! Stay up to date and be in the know! 😉✨

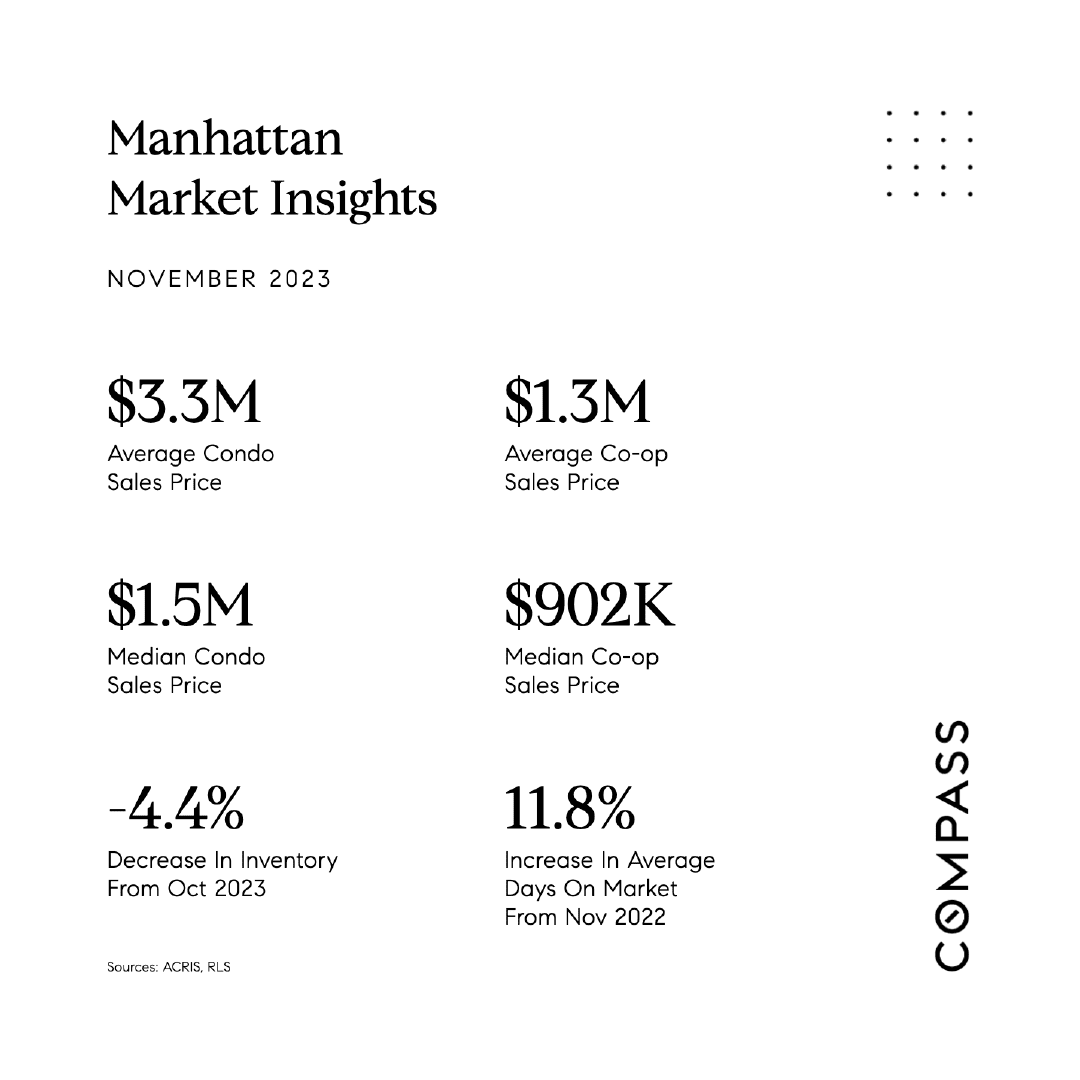
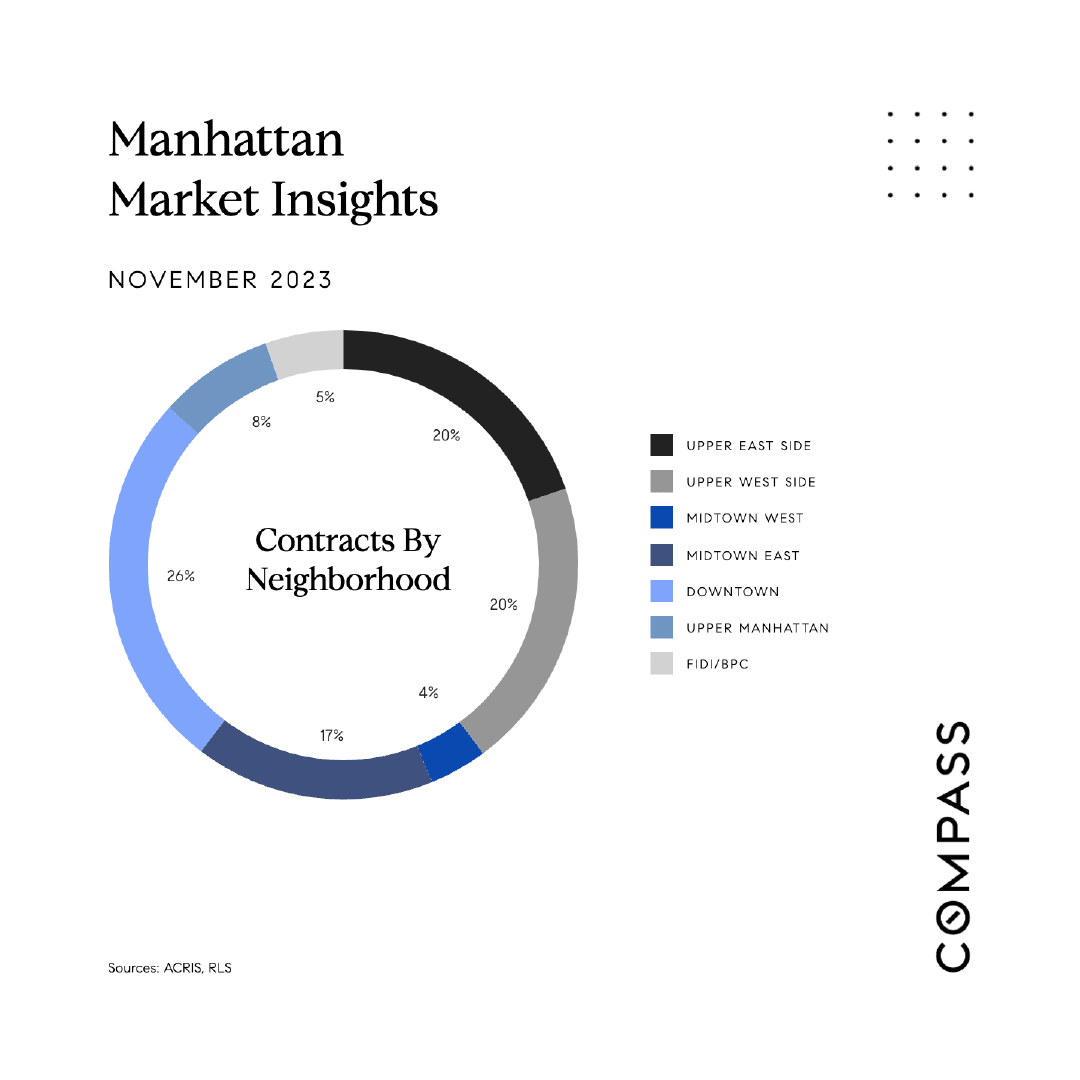
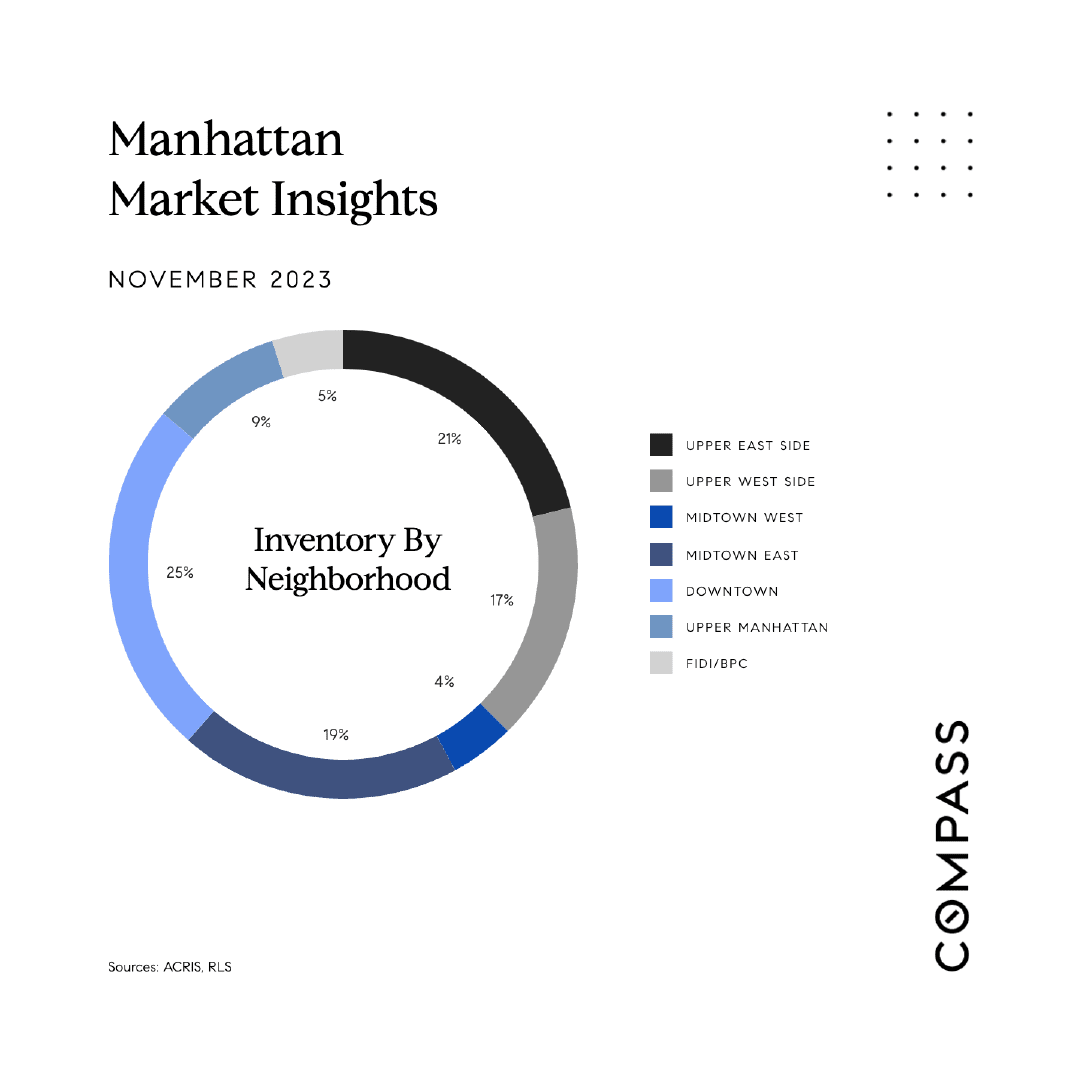
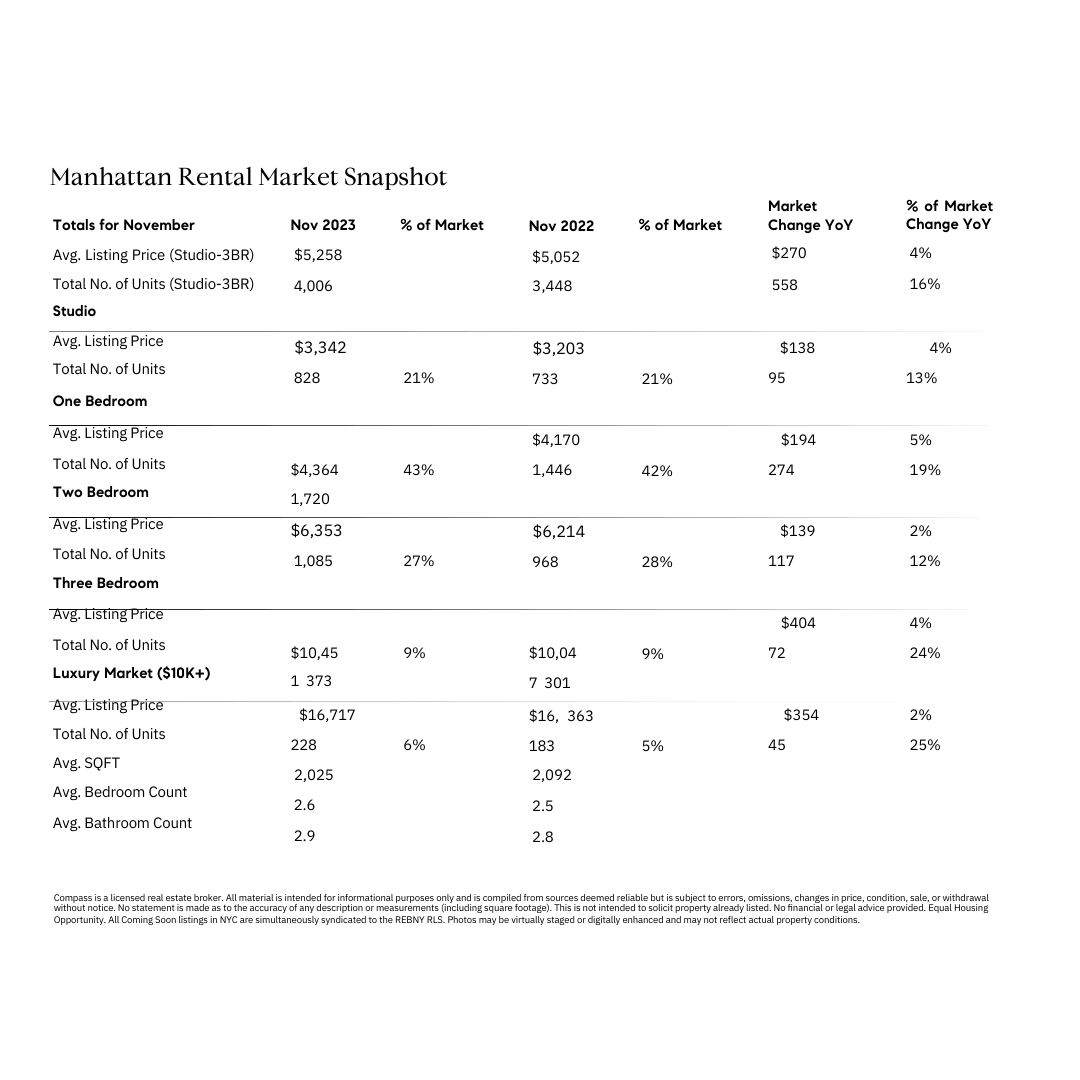
MANHATTAN NOVEMBER 2023 MARKET REPORT

BROOKLYN NOVEMBER 2023 MAKET REPORT

QUEENS NOVEMBER 2023 MARKET REPORT
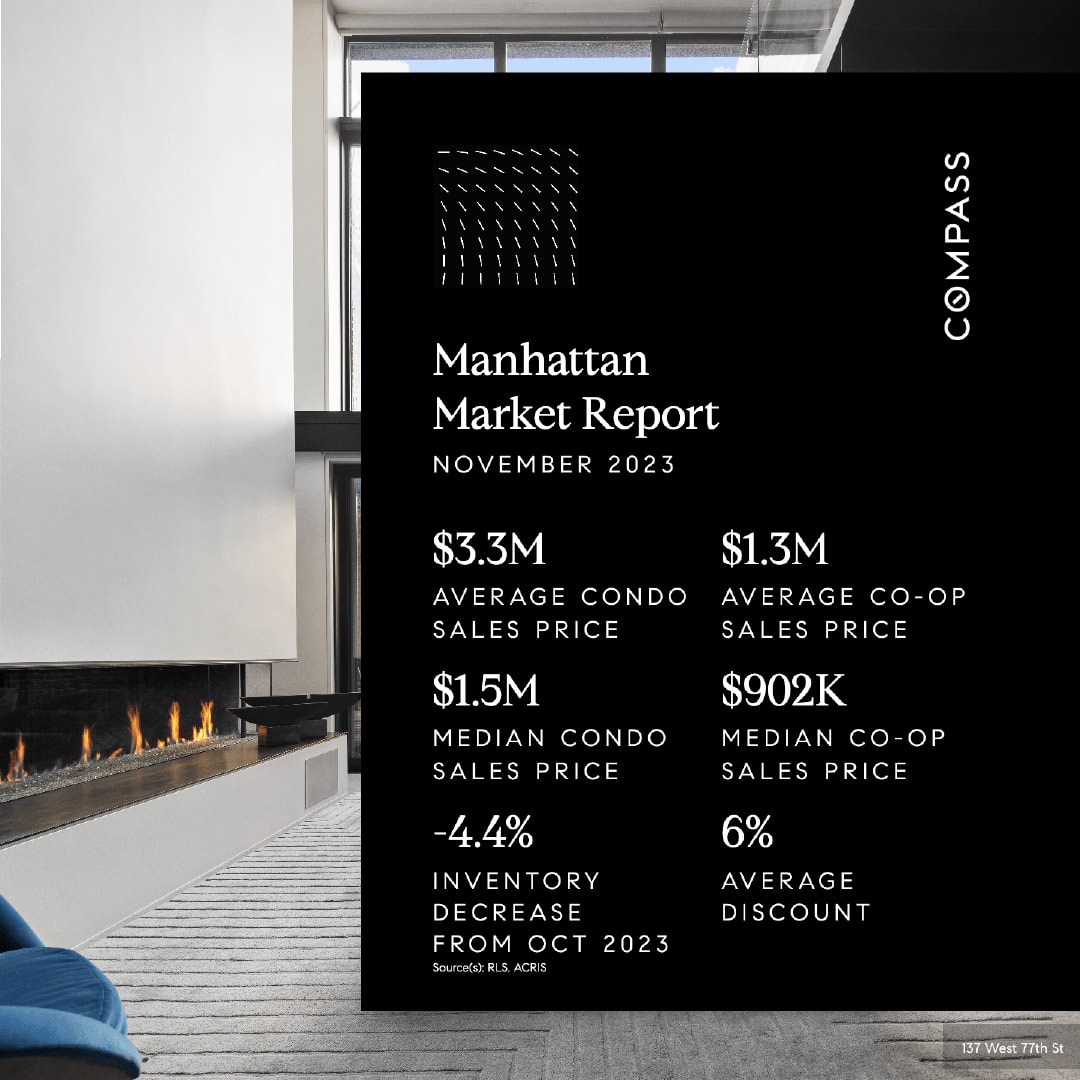
Manhattan November 2023 market report with condo and co-op prices, inventory decrease, and average discount.Manhattan November 2023 market insights: condo and co-op prices, inventory, and days on market.November 2023 Manhattan contracts by neighborhood chart, with Downtown leading at 26%.Manhattan November 2023 inventory by neighborhood: Downtown 25%, Upper East Side 21%, Midtown East 19%, Upper West Side 17%, Midtown West 4%, Upper Manhattan 9%, FIDI/BPC 5%.

Manhattan rental market snapshot comparing November 2023 and 2022 listing prices and unit counts.

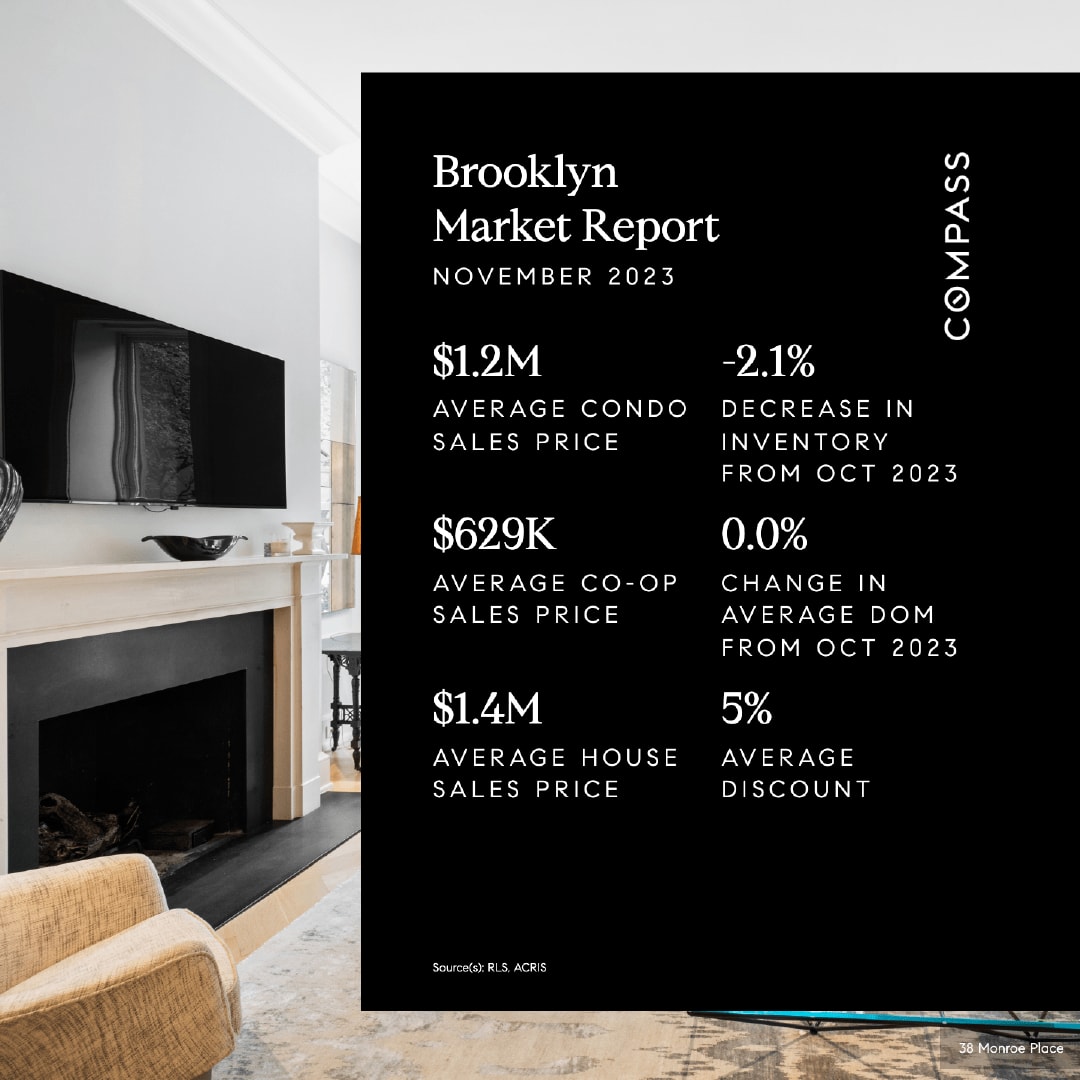
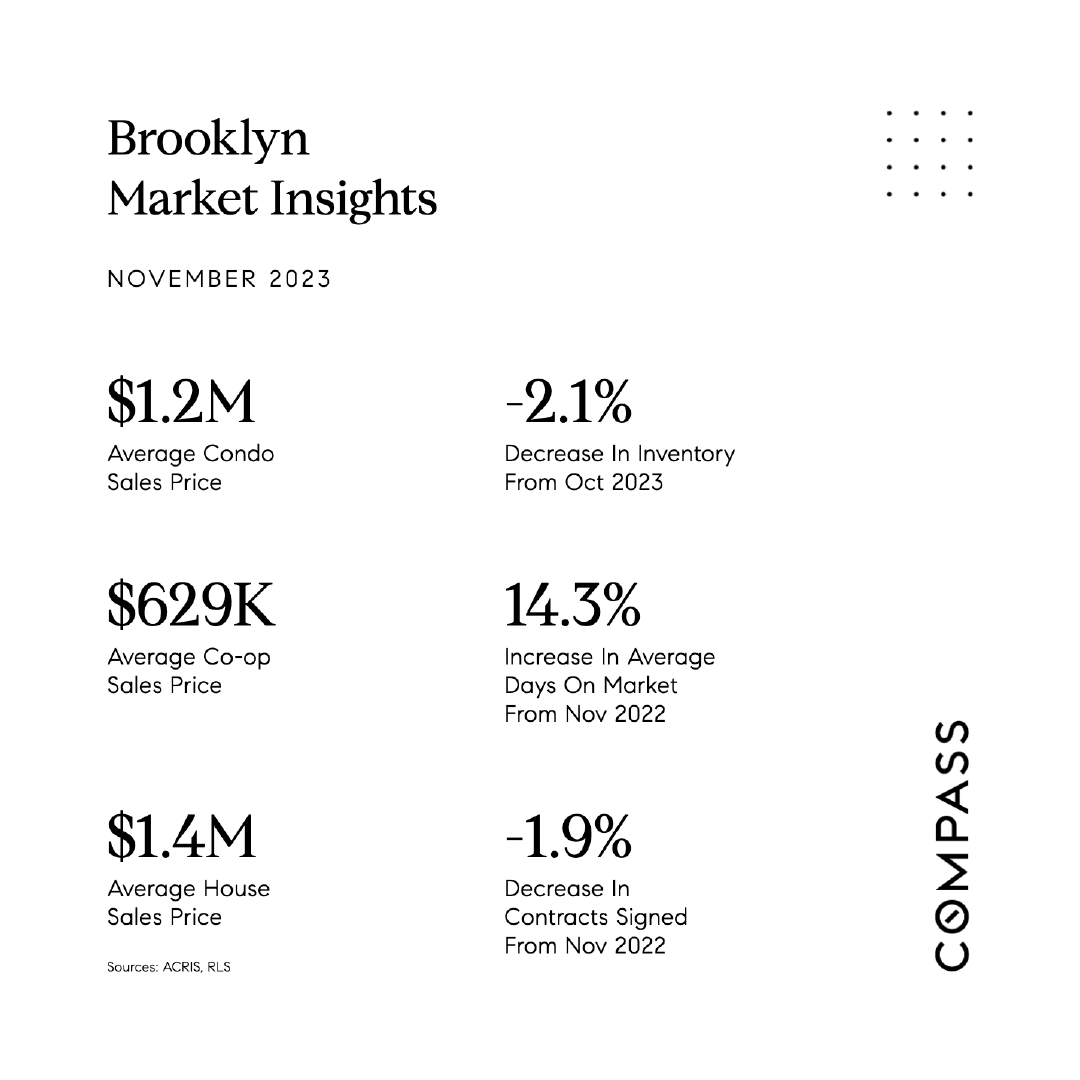
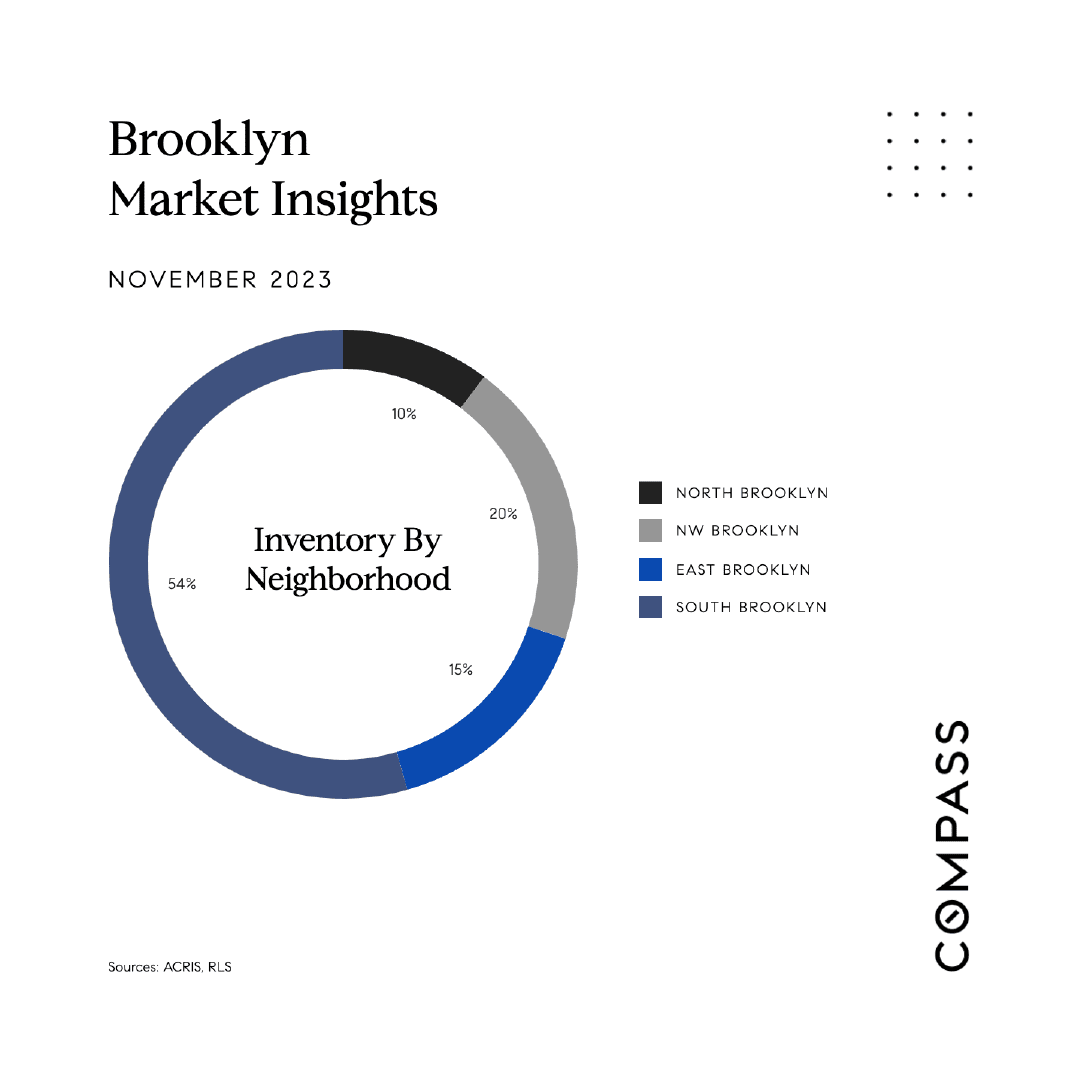
Brooklyn November 2023 market report with average sales prices, inventory change, days on market, and discount.Brooklyn November 2023 housing market infographic with average sale prices and changes in inventory, market time, and contracts.Brooklyn November 2023 inventory chart showing neighborhood shares, led by South Brooklyn at 54%.

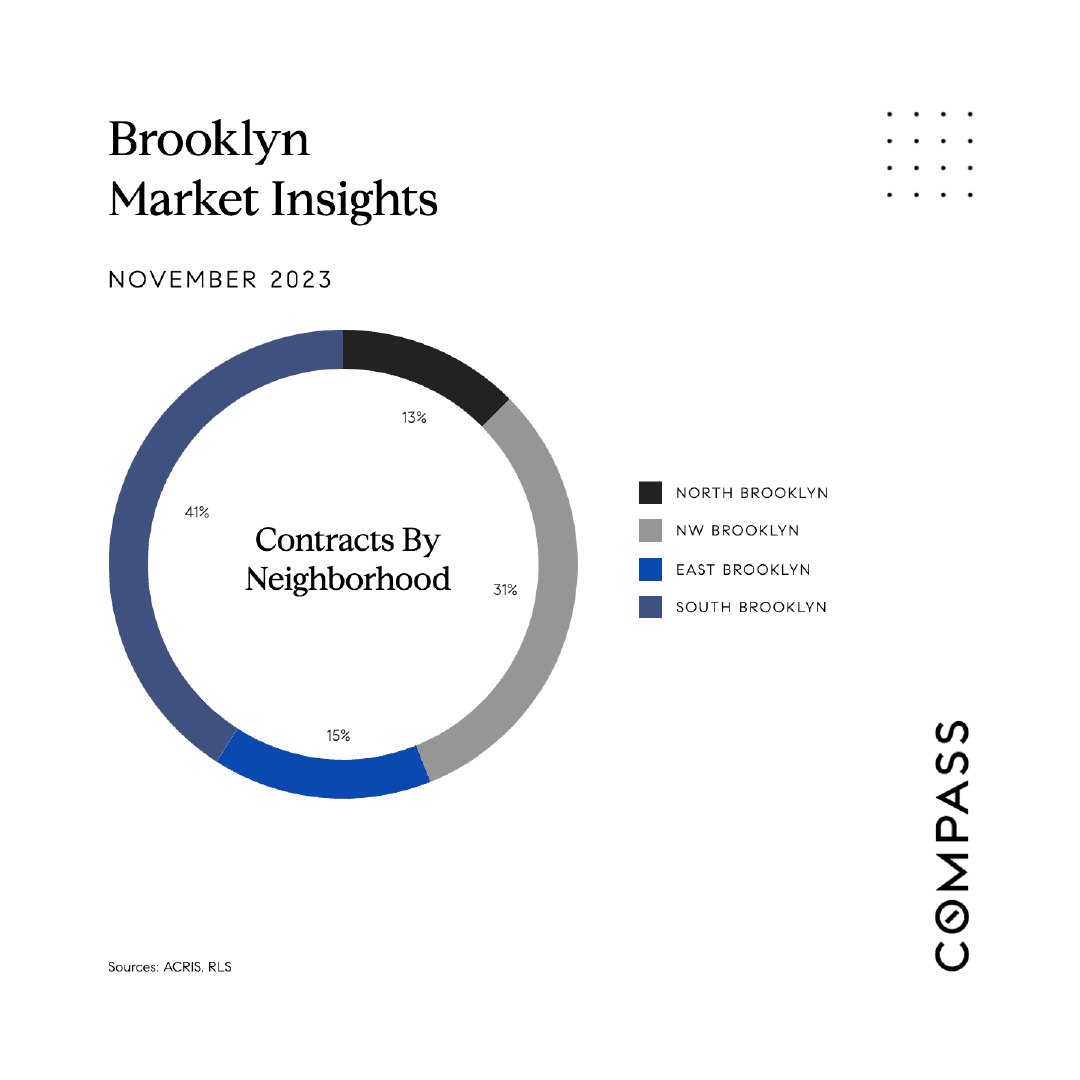
Brooklyn November 2023 contracts by neighborhood: South Brooklyn 41%, NW Brooklyn 31%, East Brooklyn 15%, North Brooklyn 13%.

Brooklyn rental market snapshot comparing November 2023 and November 2022 prices, unit counts, and year-over-year changes.

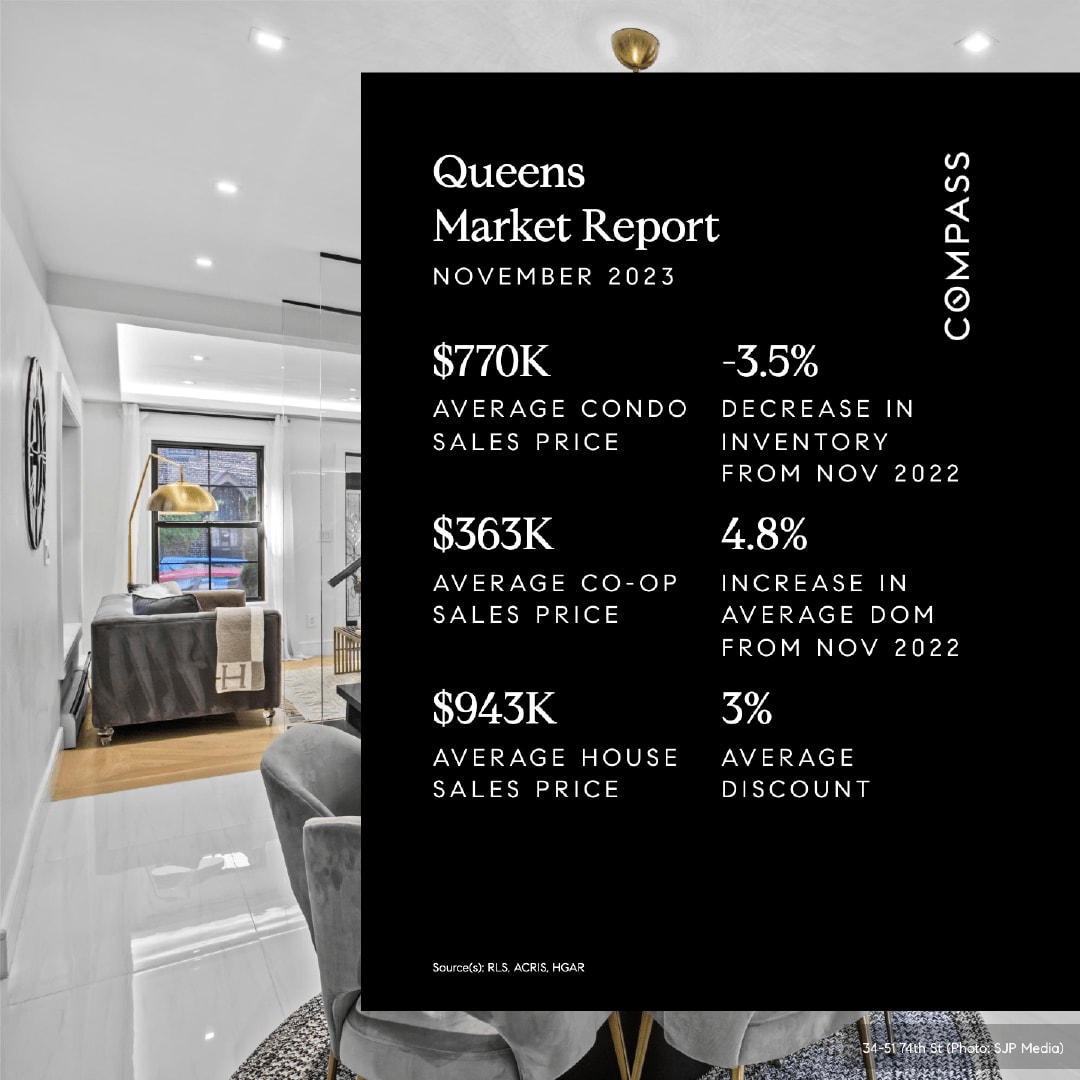
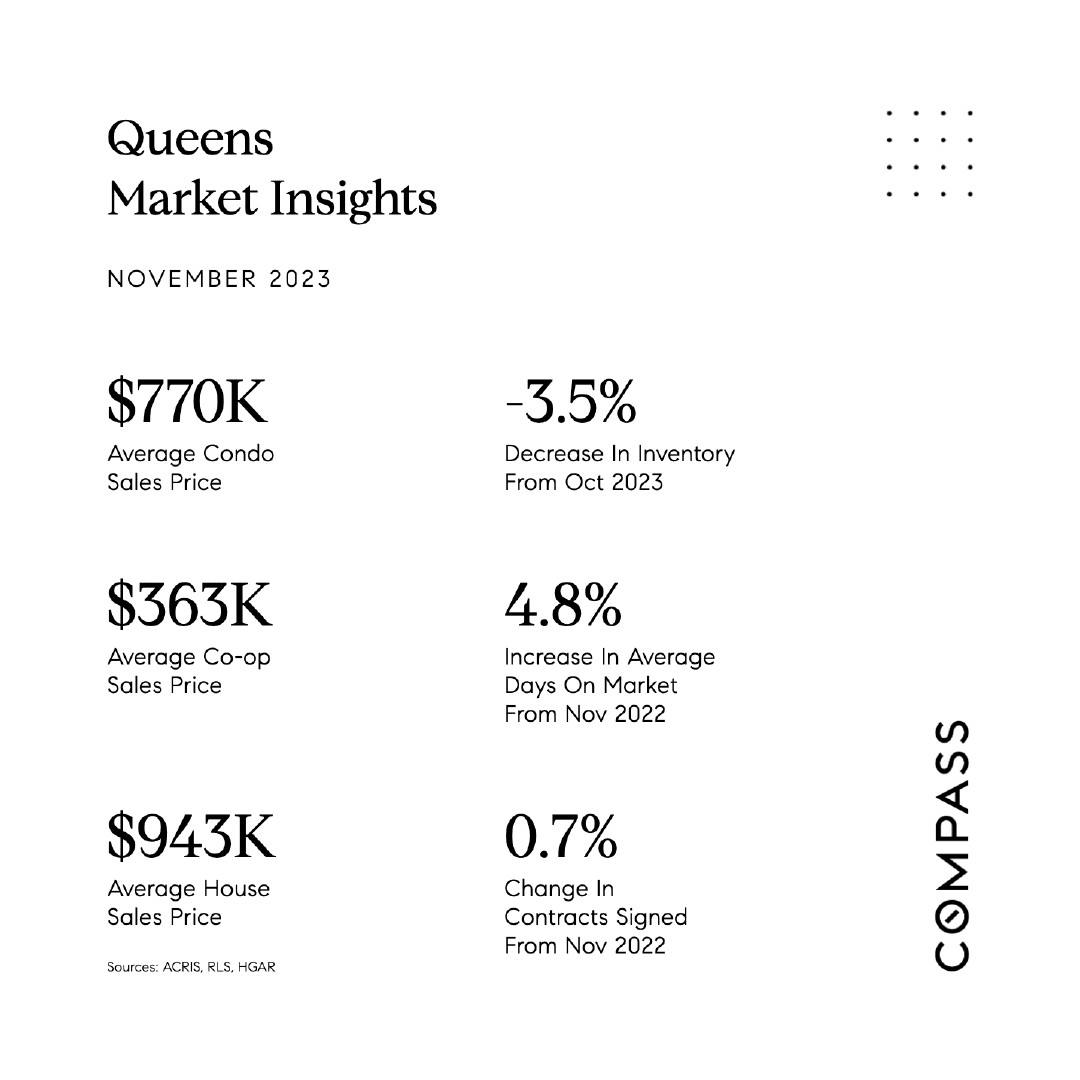
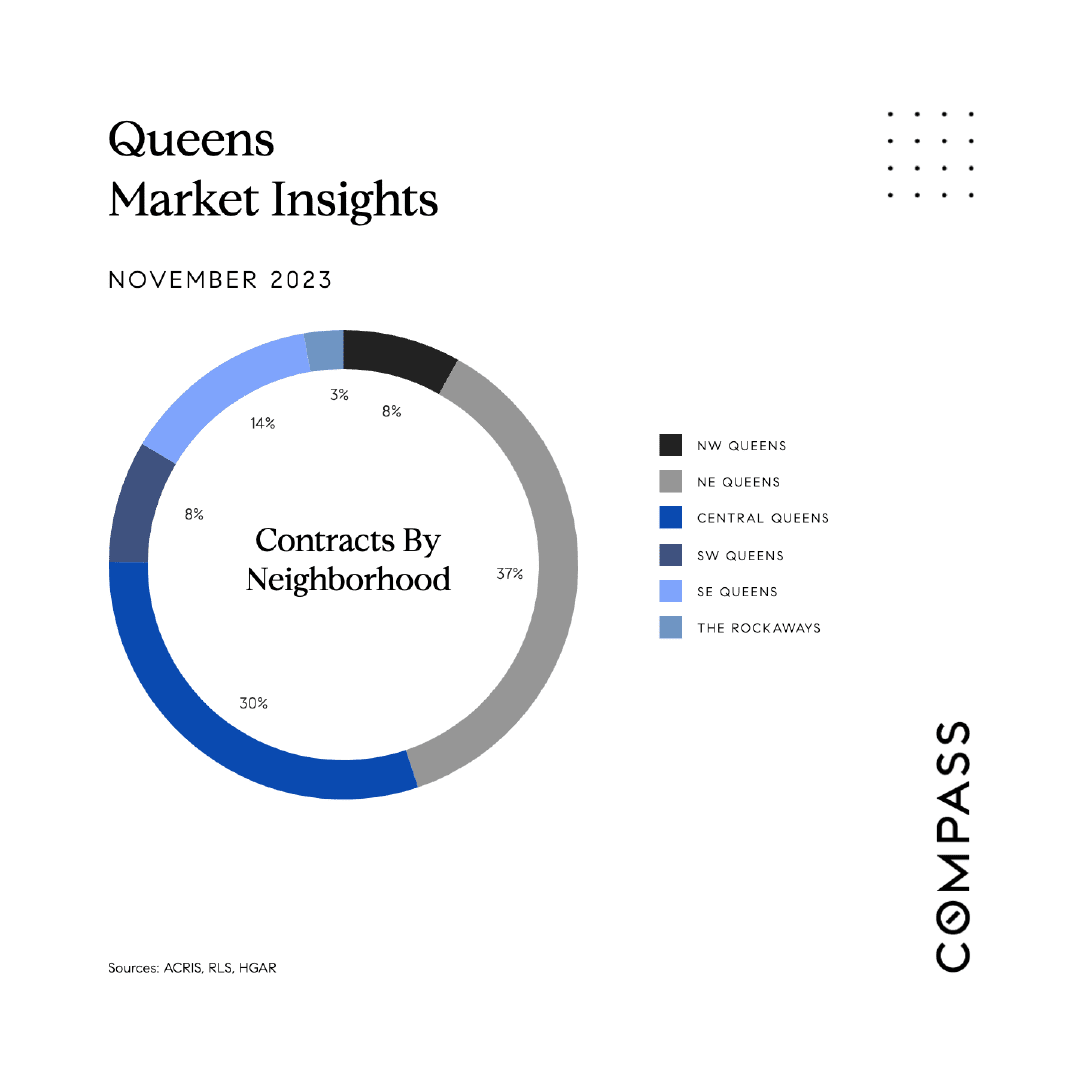
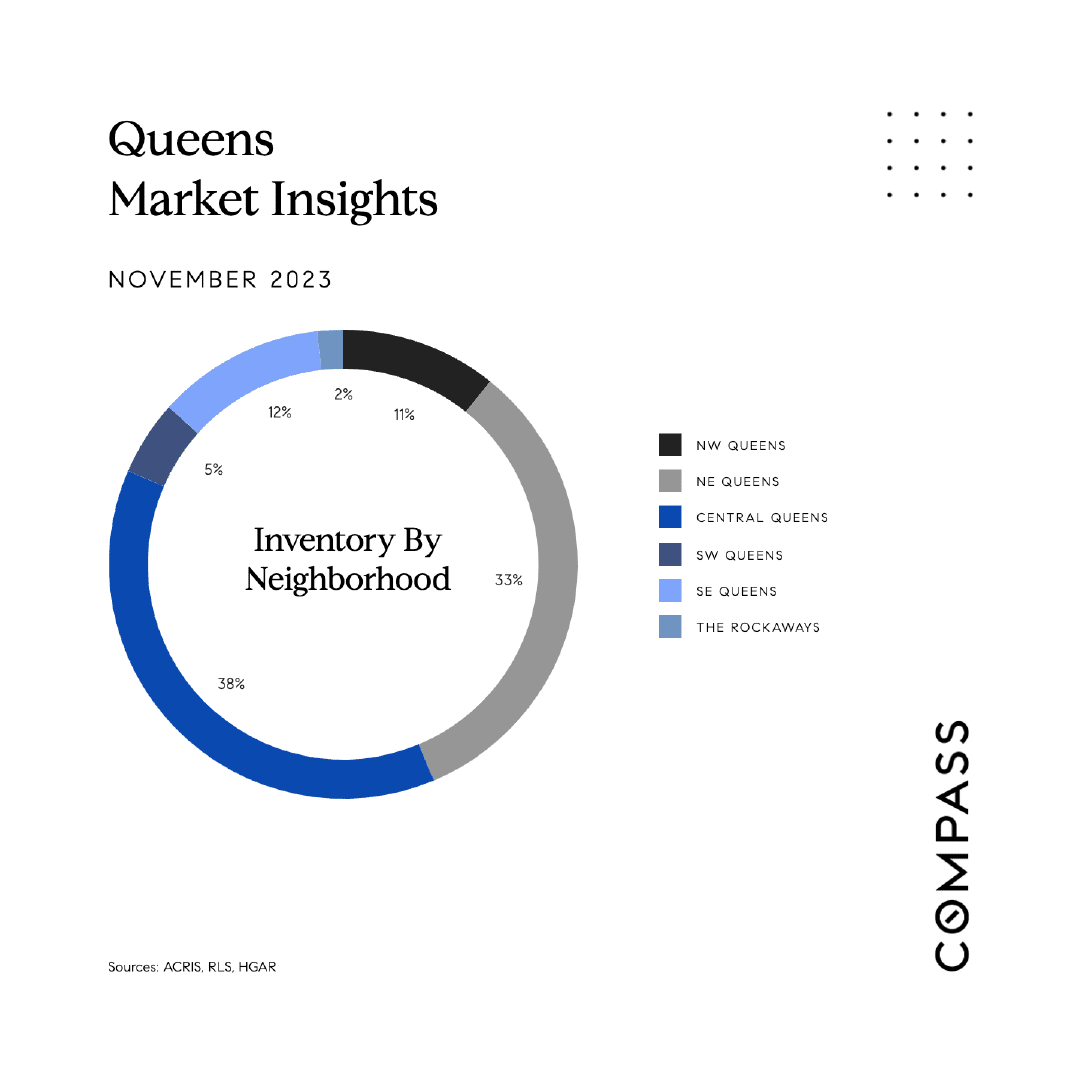
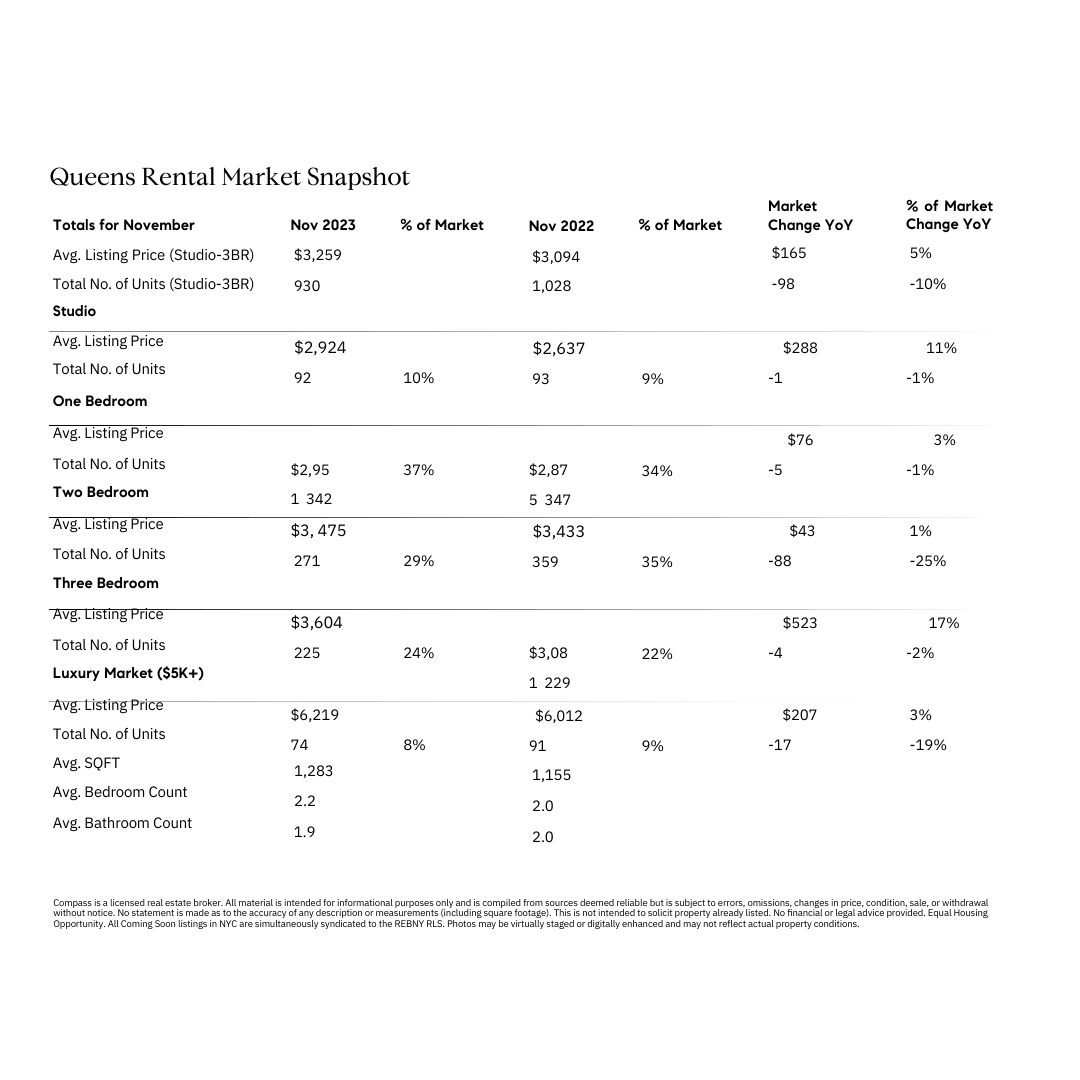
Queens November 2023 market report: home prices, inventory, days on market, and average discount.Queens November 2023 market insights: condo, co-op and house prices, inventory, days on market, and contracts signed.Queens November 2023 contracts by neighborhood: NE Queens 37%, Central Queens 30%, SE Queens 14%, and others.Queens November 2023 inventory by neighborhood: Central 38%, Northeast 33%, Southeast 12%, Northwest 11%, Southwest 5%, Rockaways 2%.Queens rental market snapshot comparing November 2023 and 2022 prices and listings by bedroom count.

Thrive Real Estate Team at Compass