Thrive Real Estate Team at Compass
πŸ“² OCTOBER 2022 MARKET SNAPSHOT πŸ“Š

πŸ“² OCTOBER 2022 MARKET SNAPSHOT πŸ“Š

  • Compass
  • November 2, 2022

We are excited to share the Compass NYC Monthly Market Snapshot. If you are curious or have any questions about your next real estate transaction we are here to help! πŸ–€πŸƒ

Also, you can watch our latest analysis and reports in our blog 🧐

#realestate #NYC #agentsofcompass #thriveatcompass
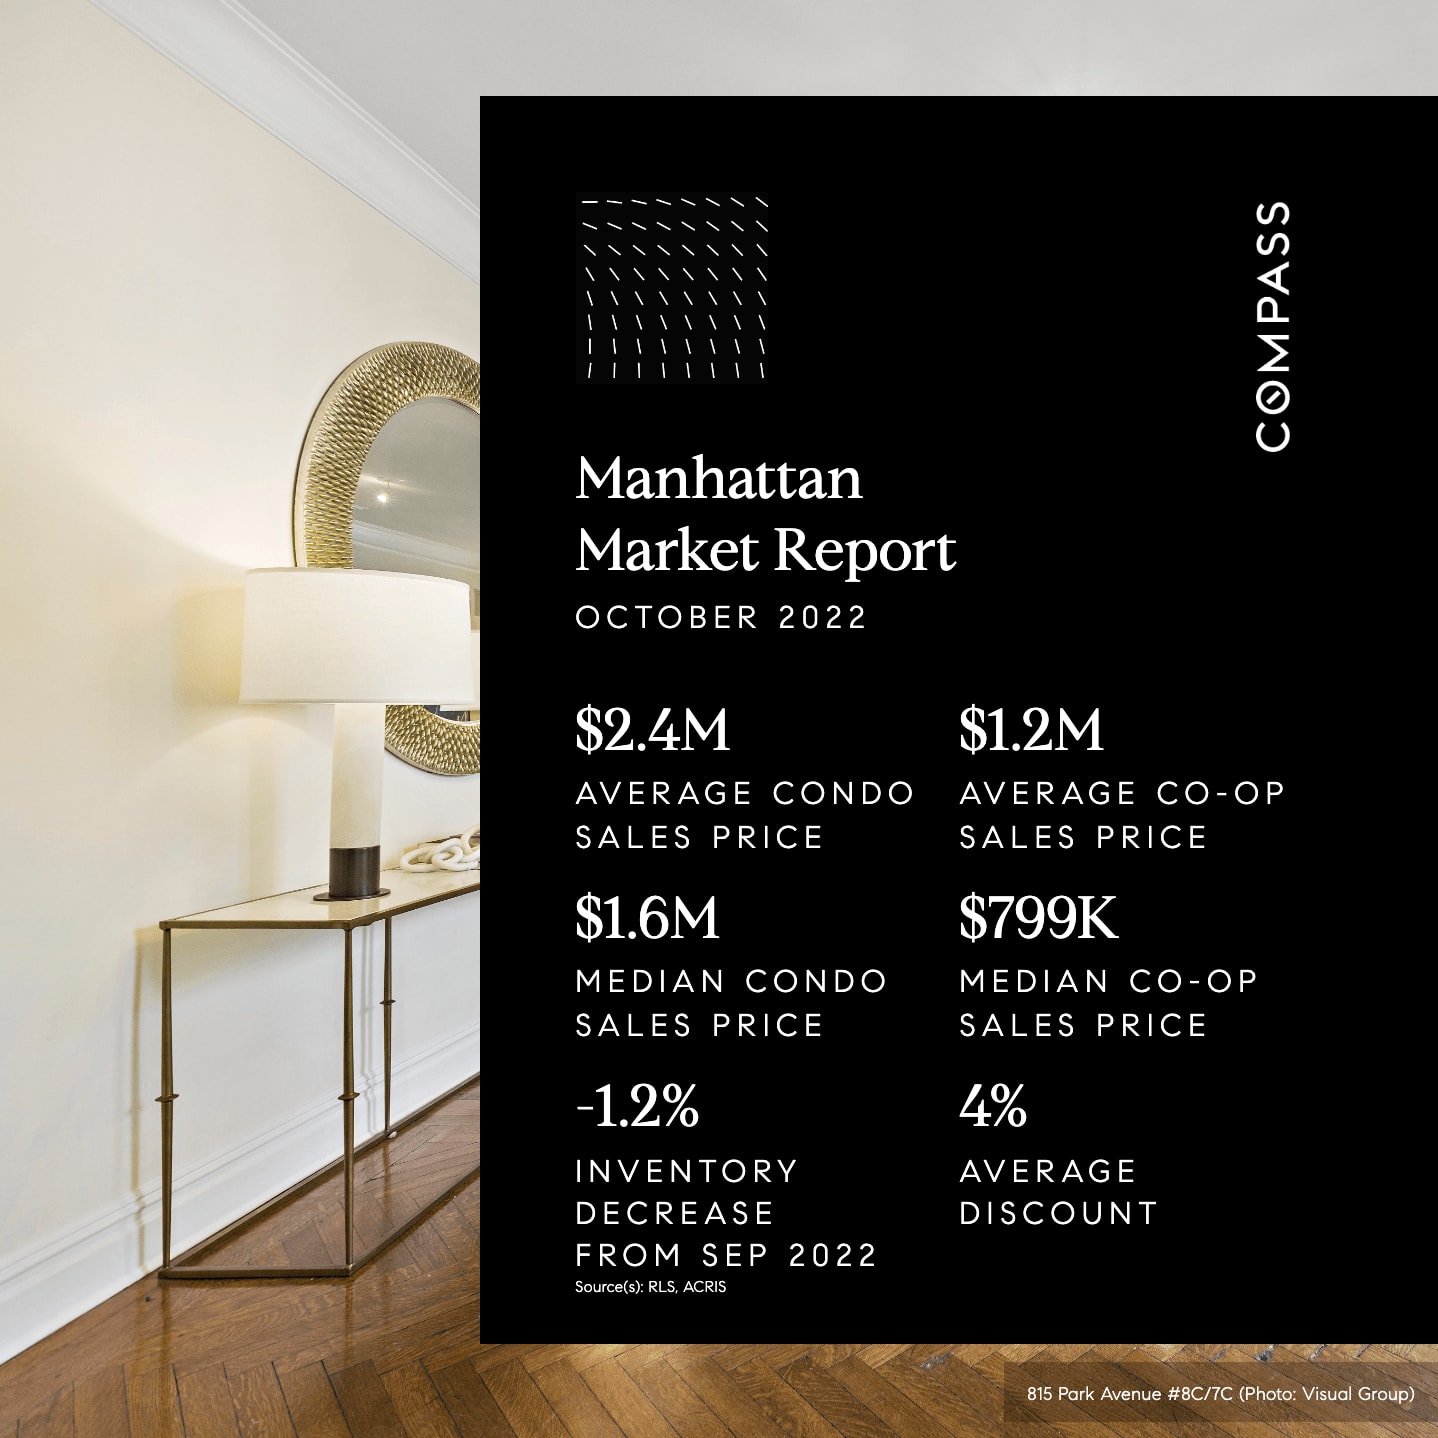
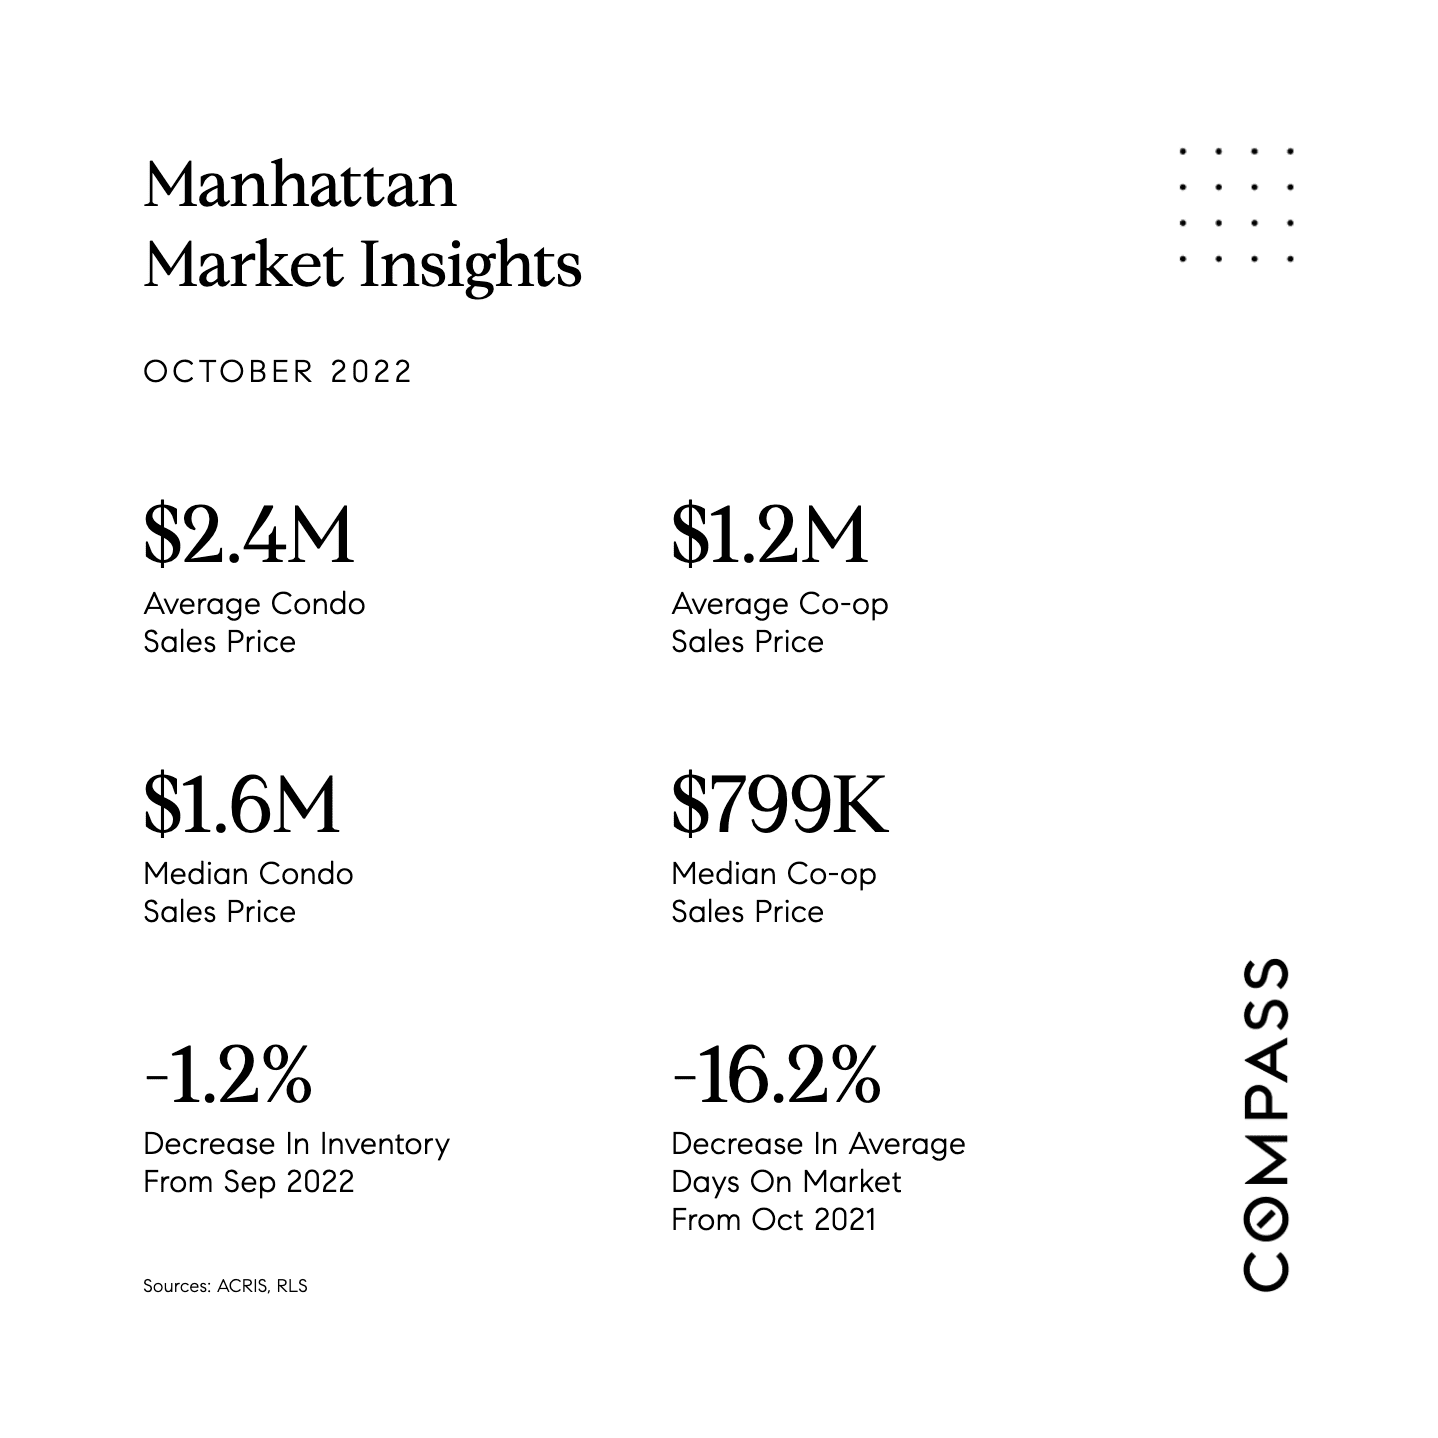
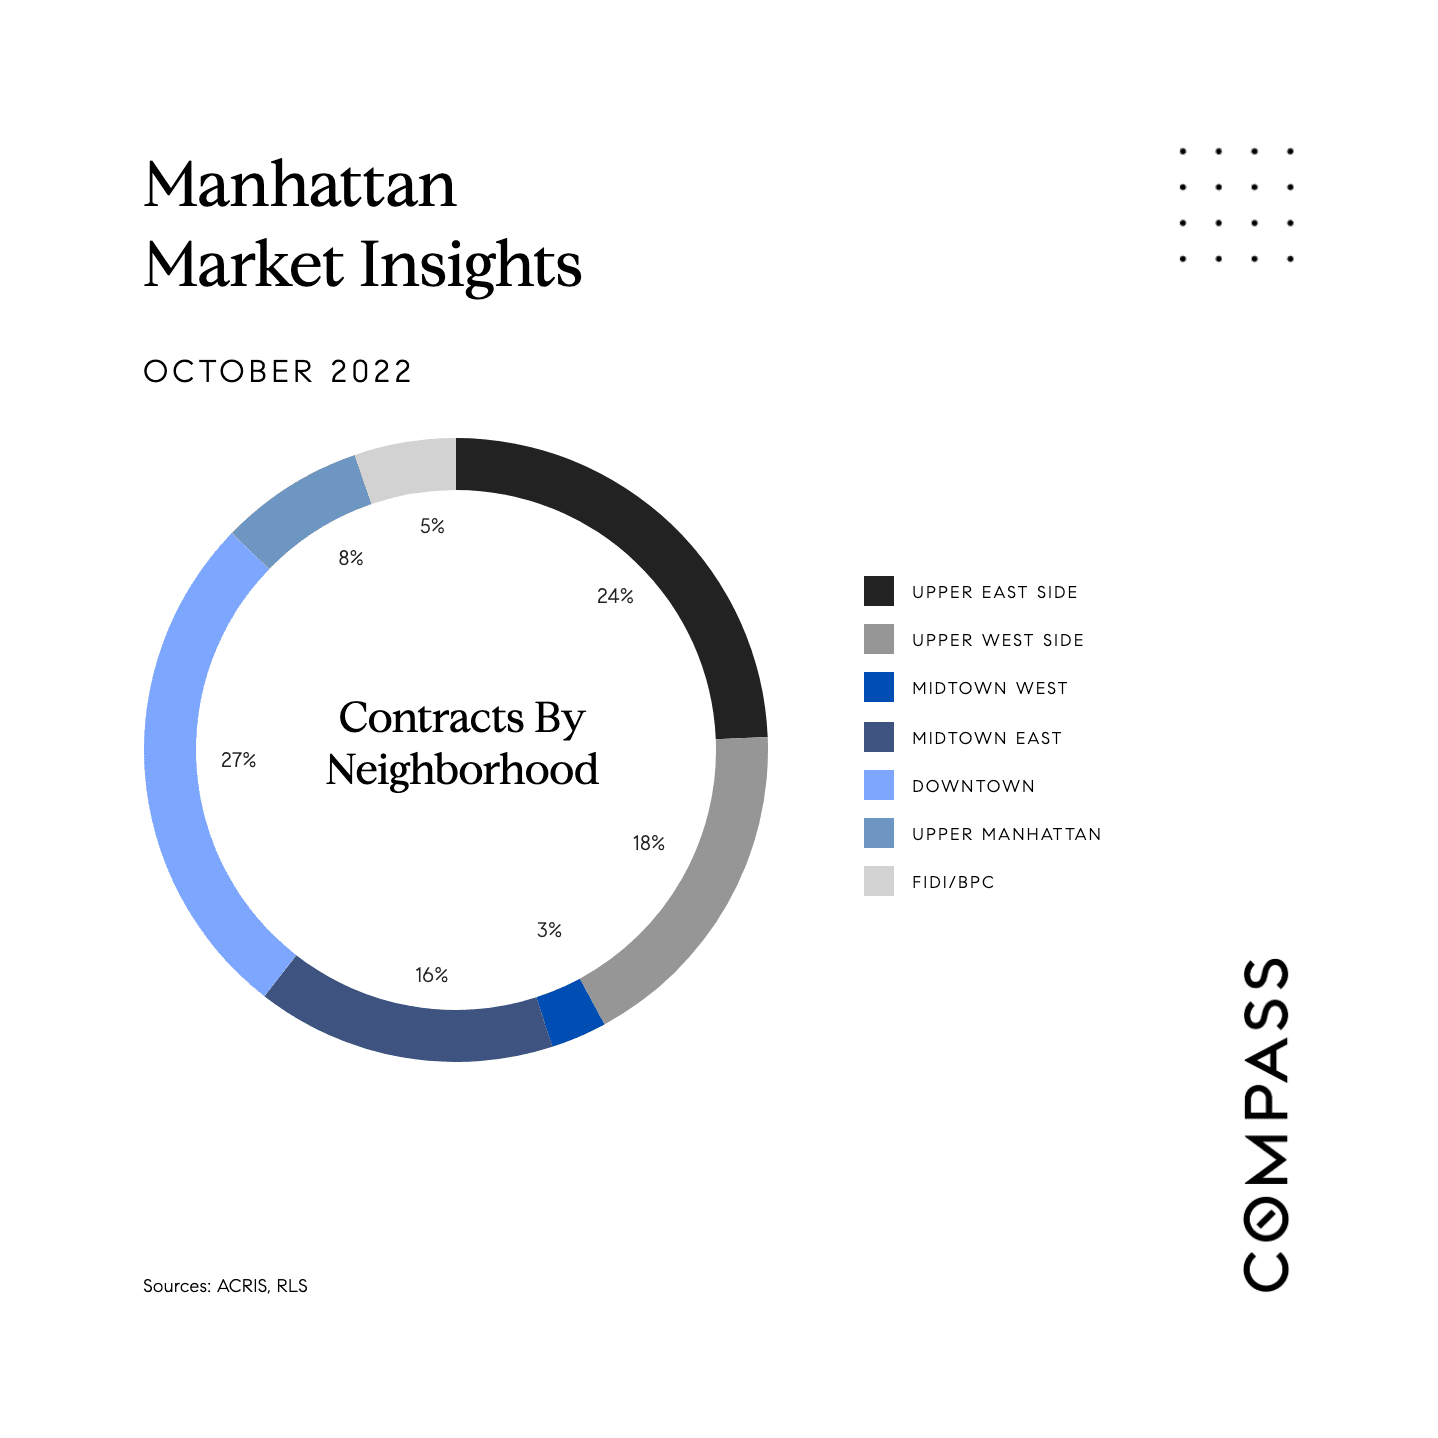
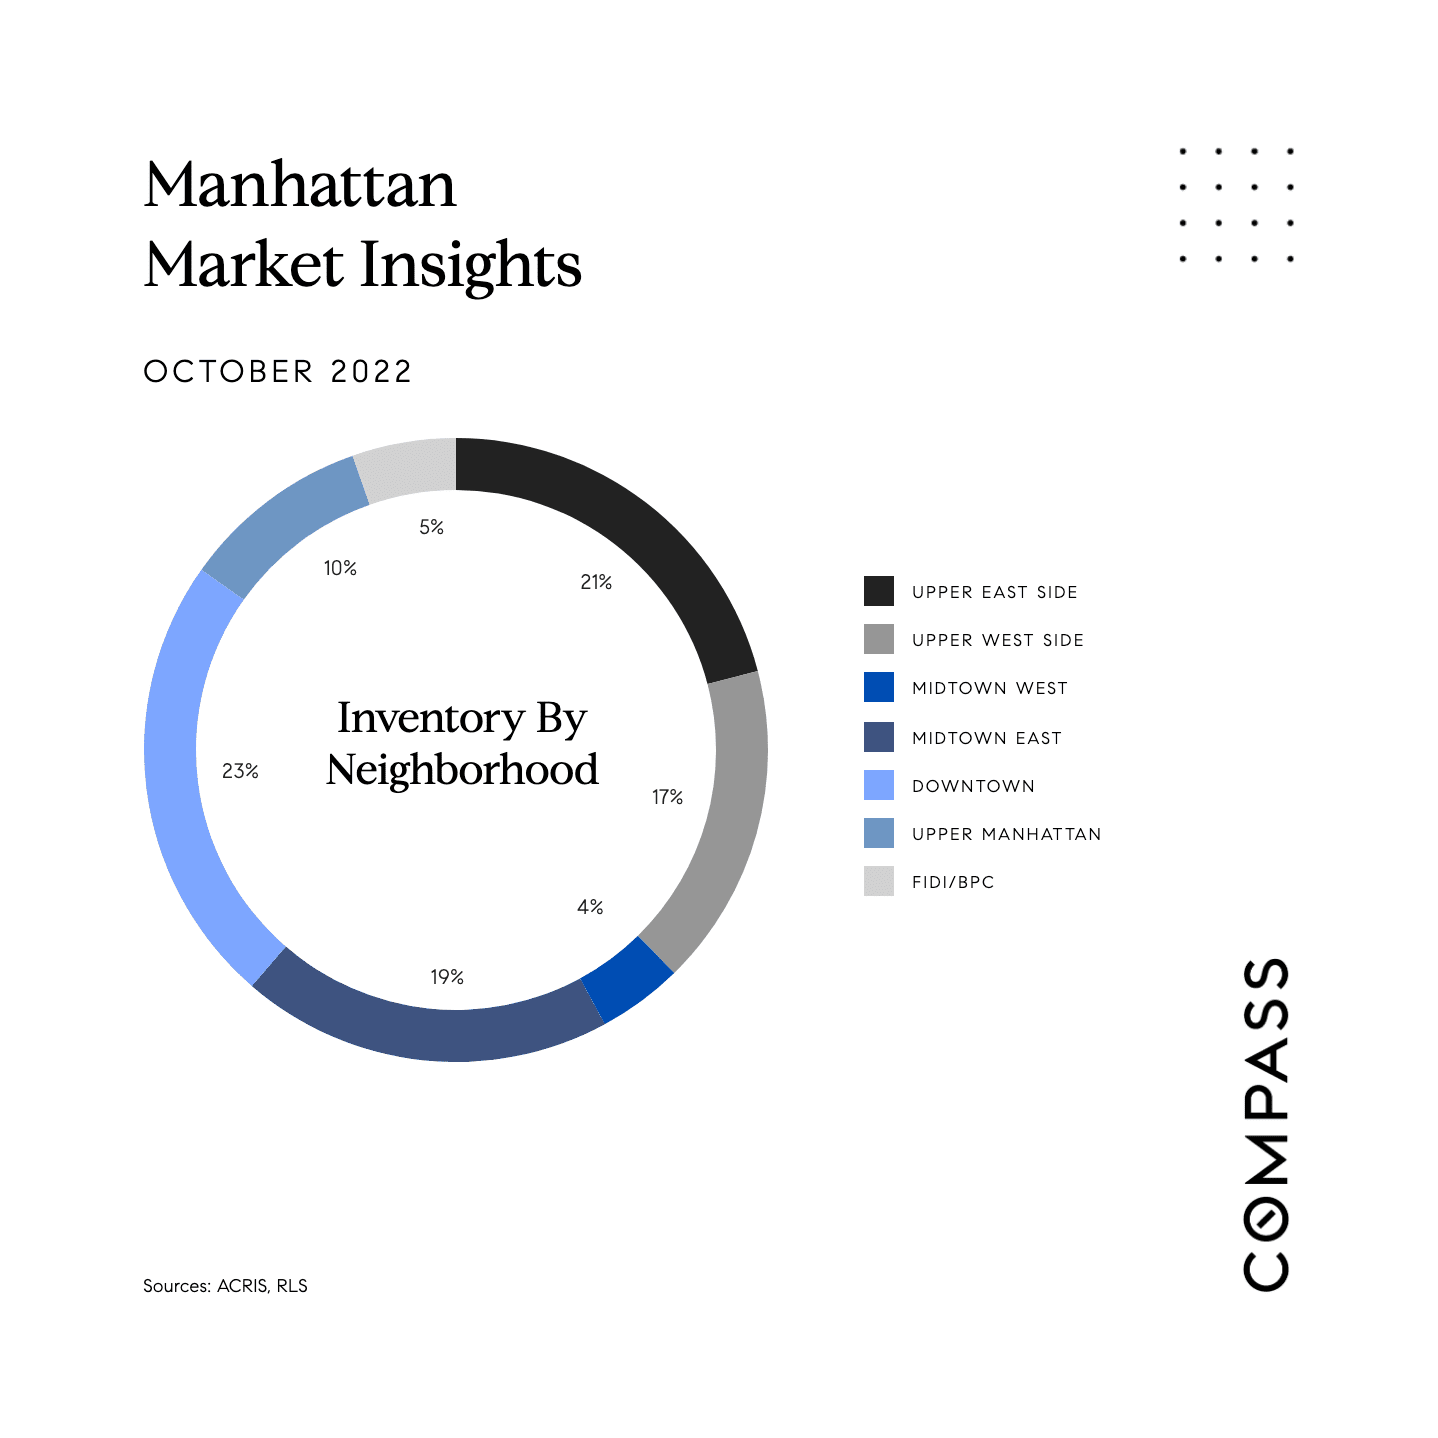
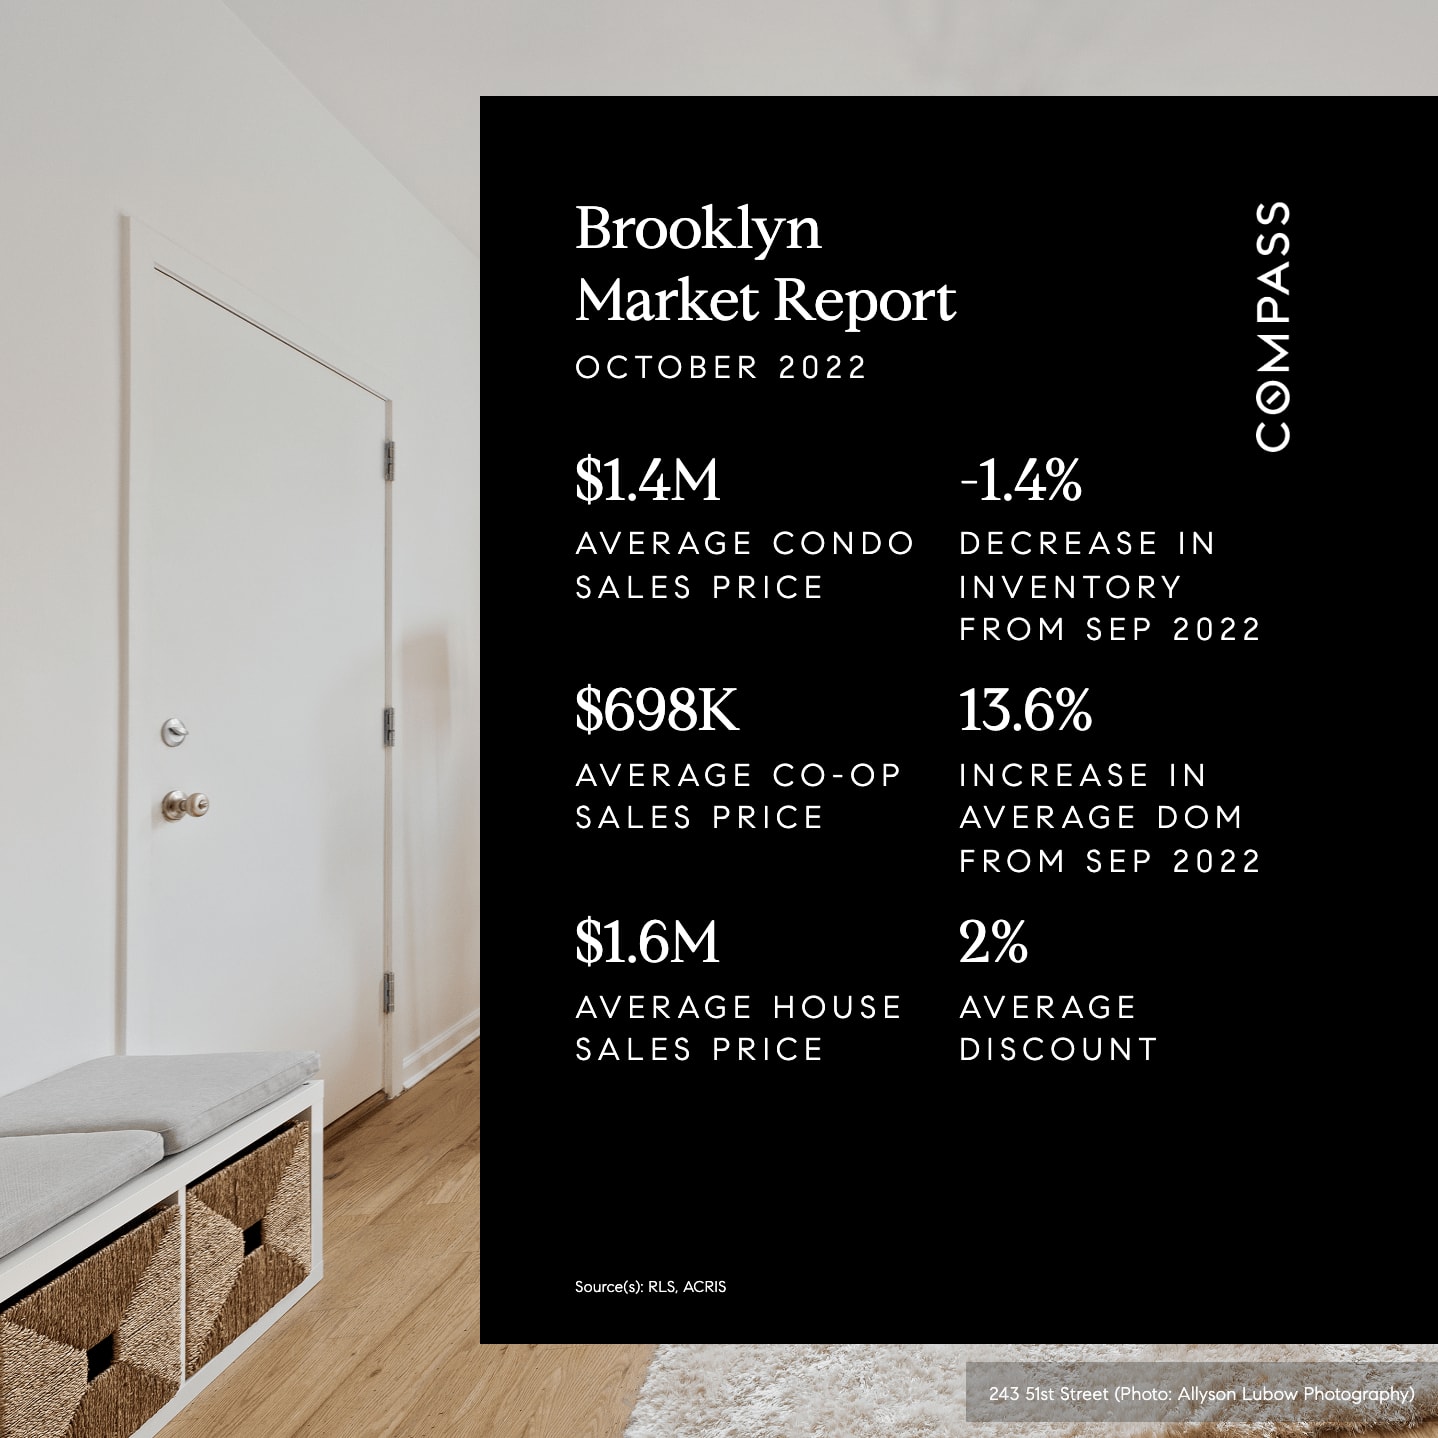
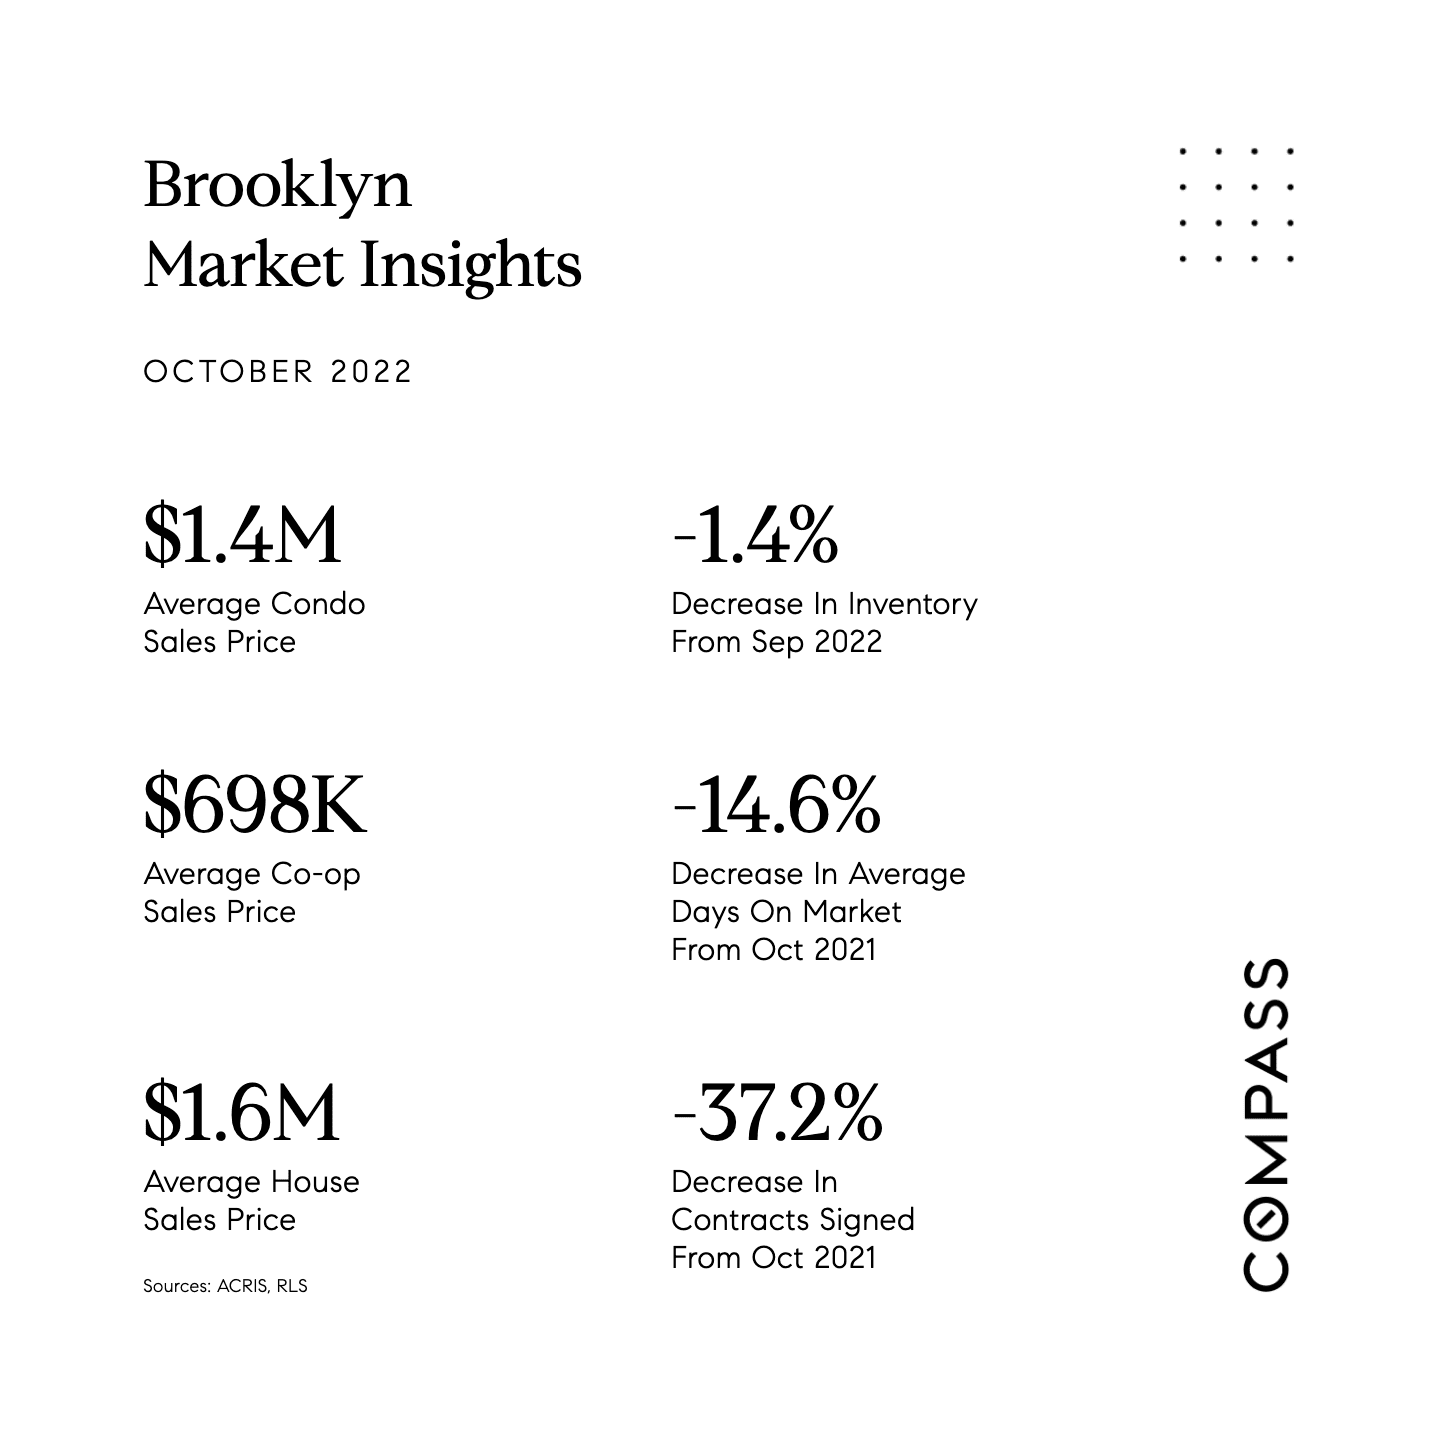
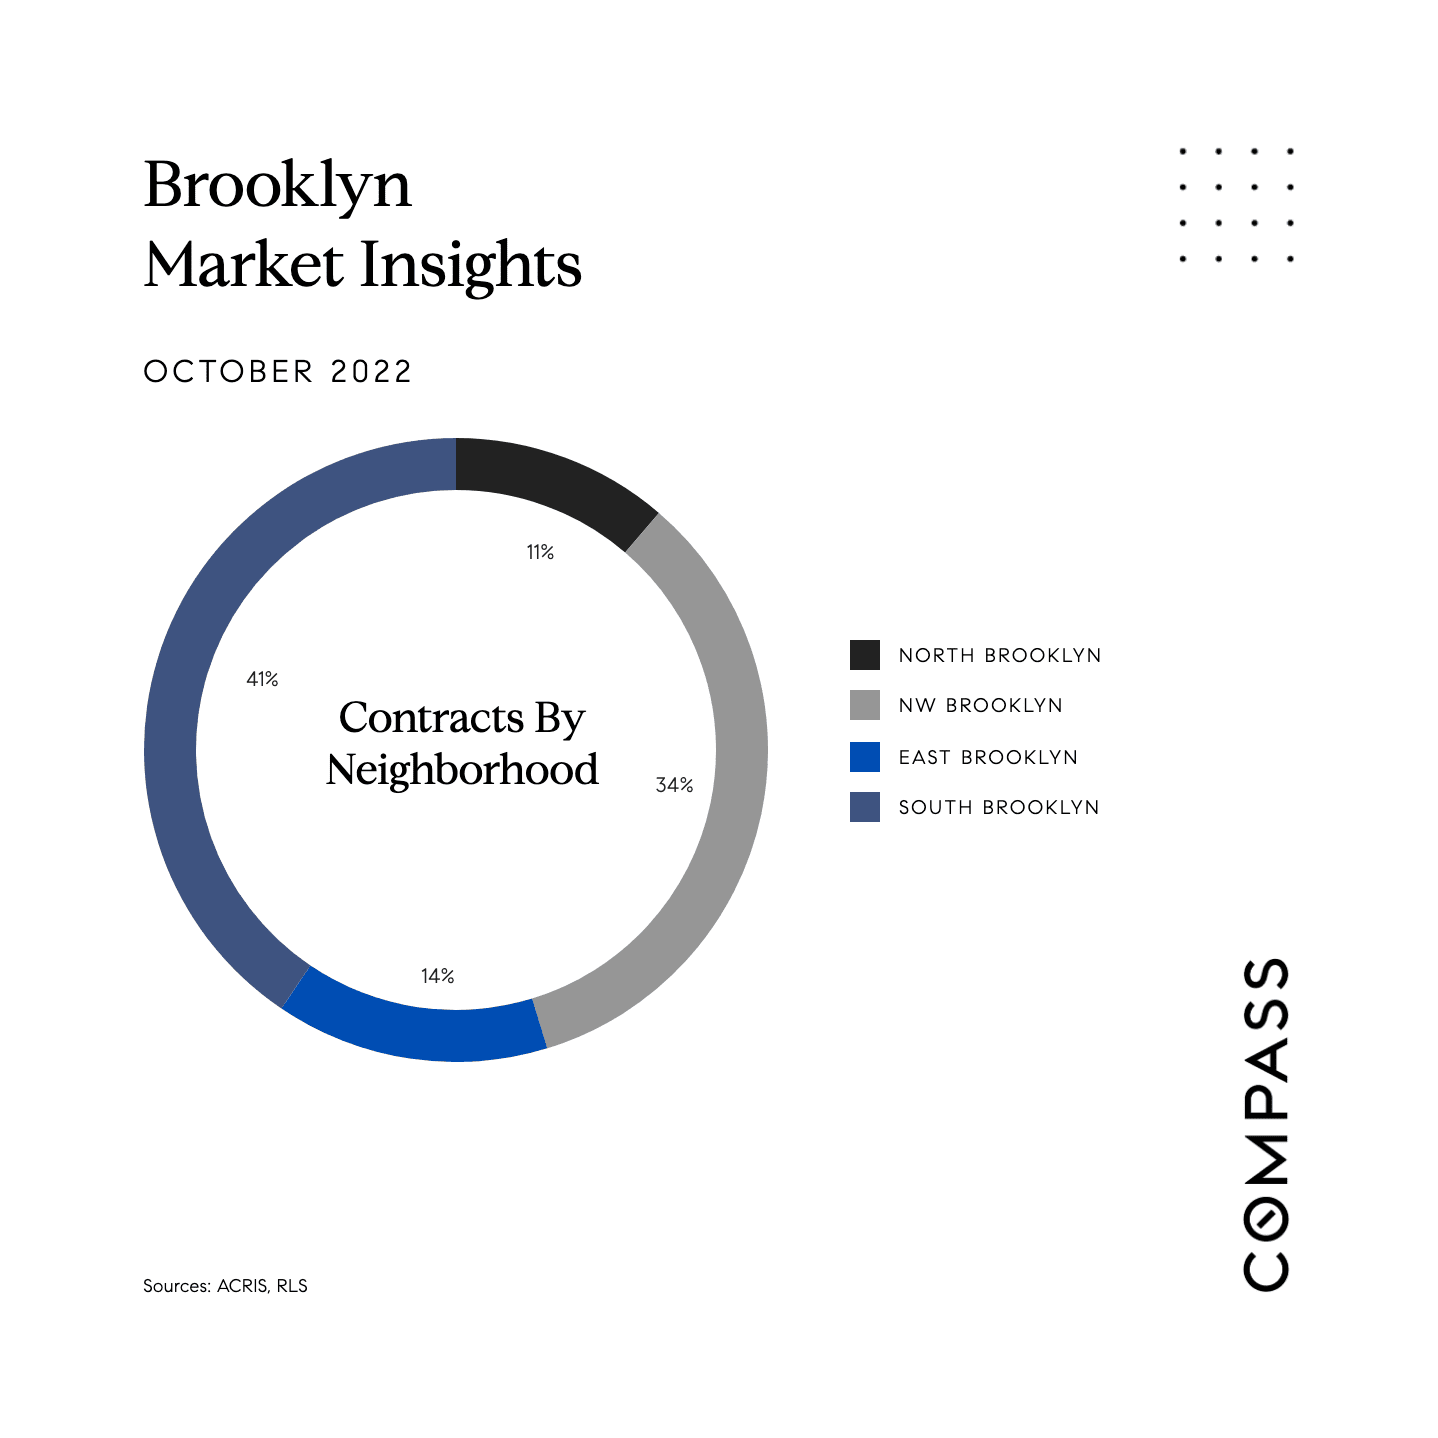
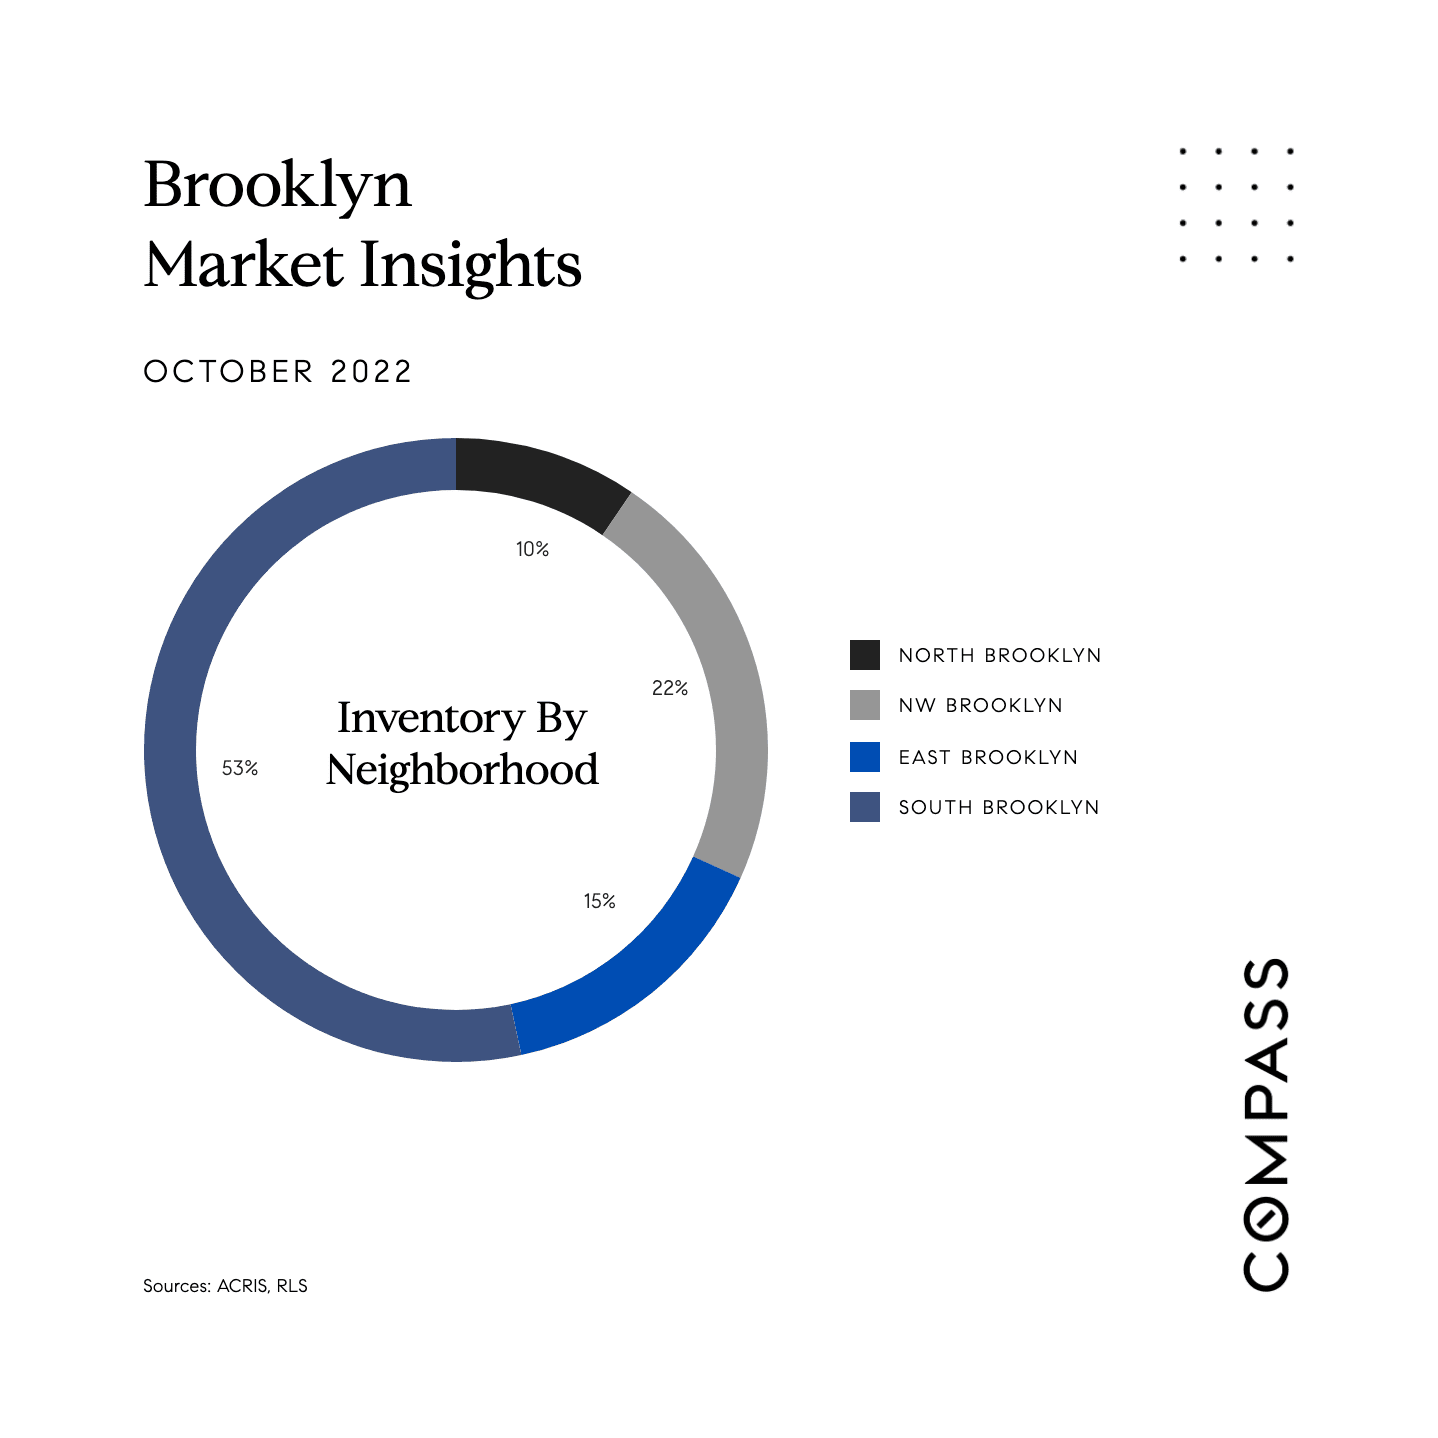
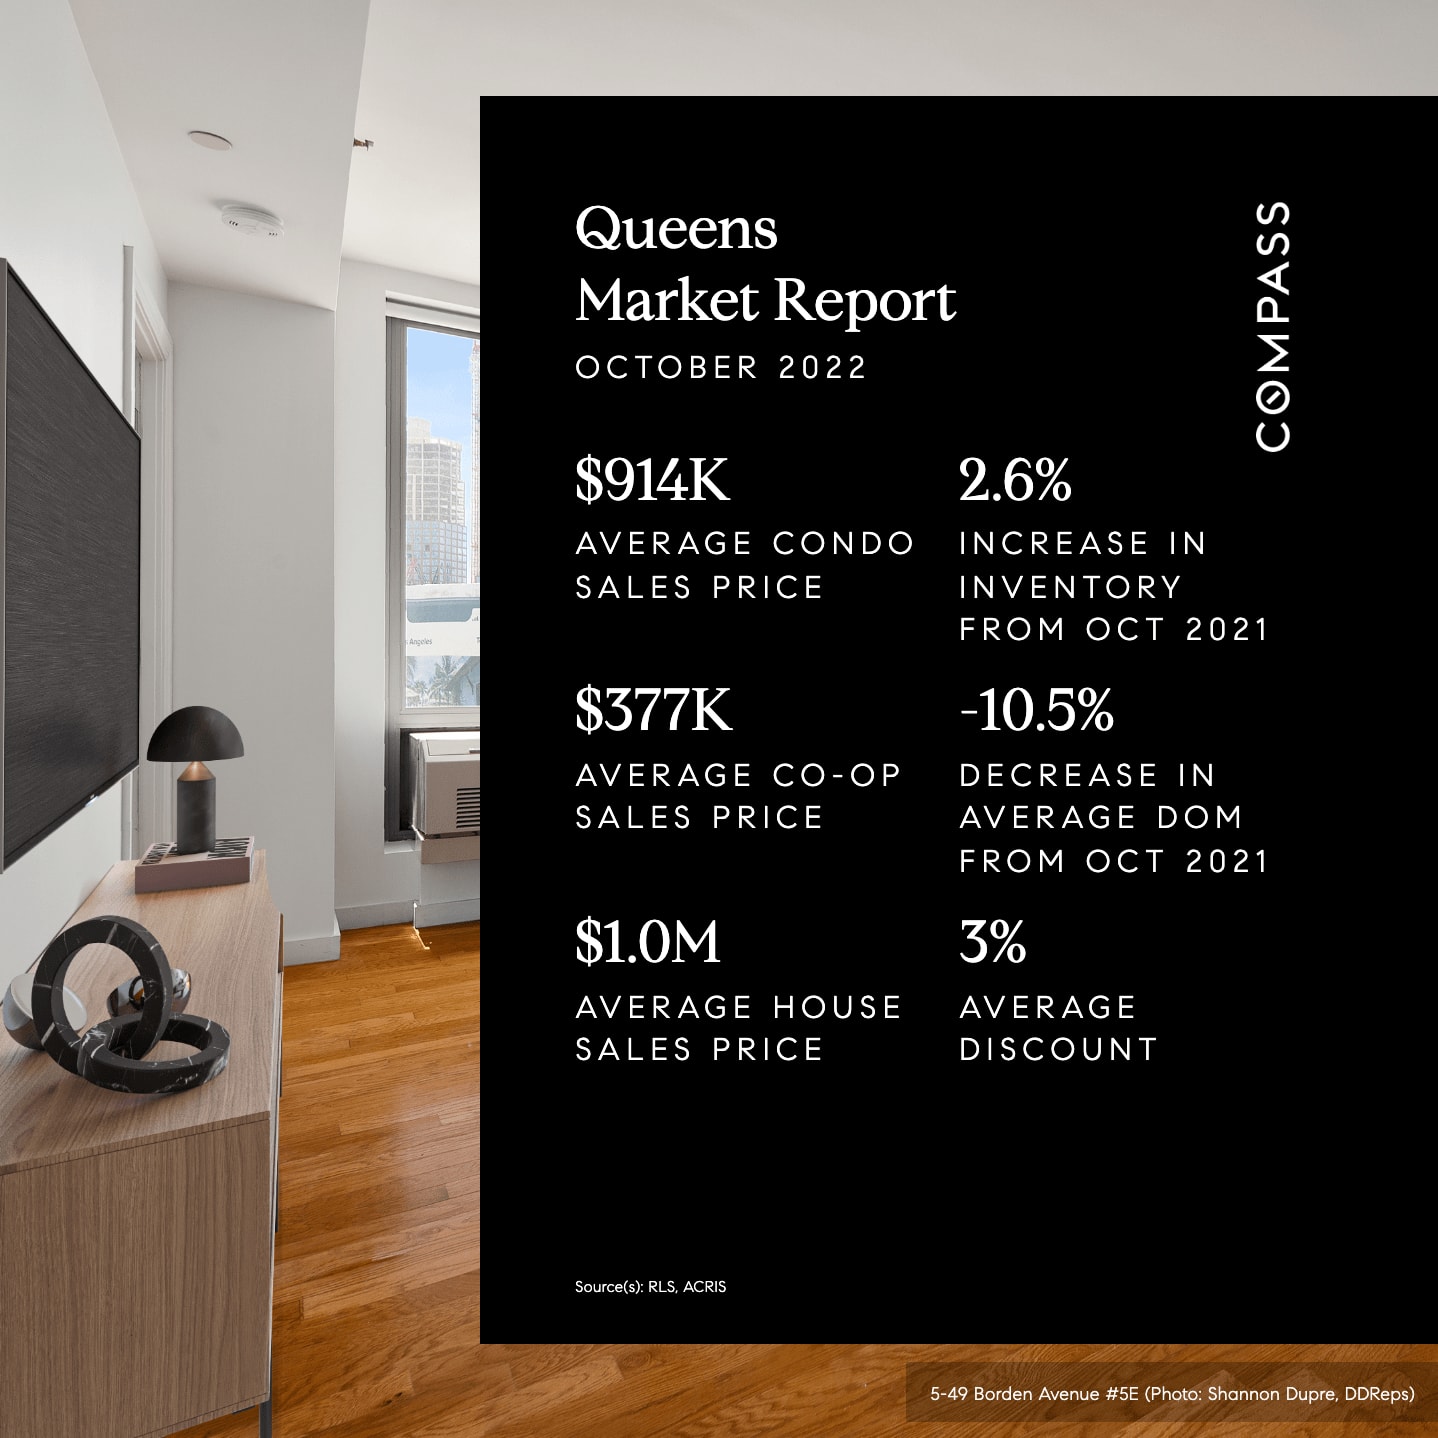
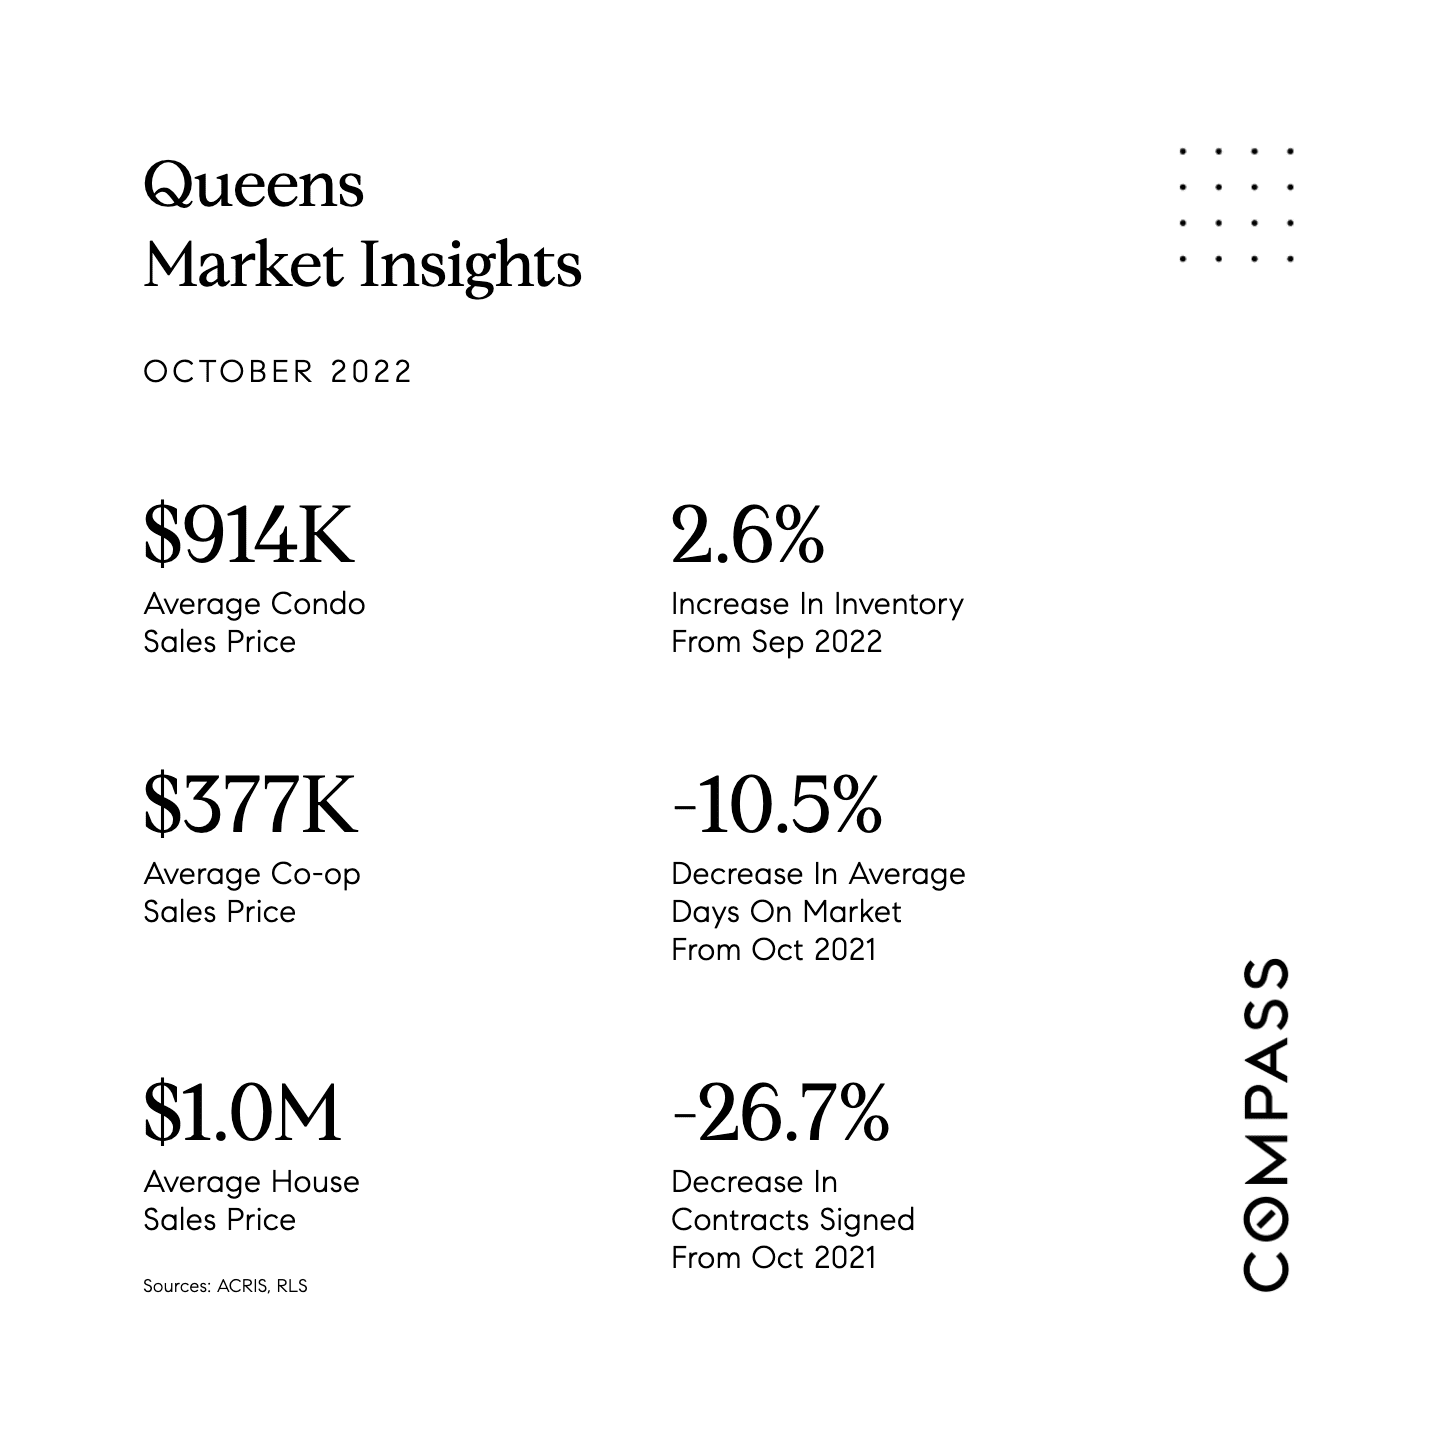
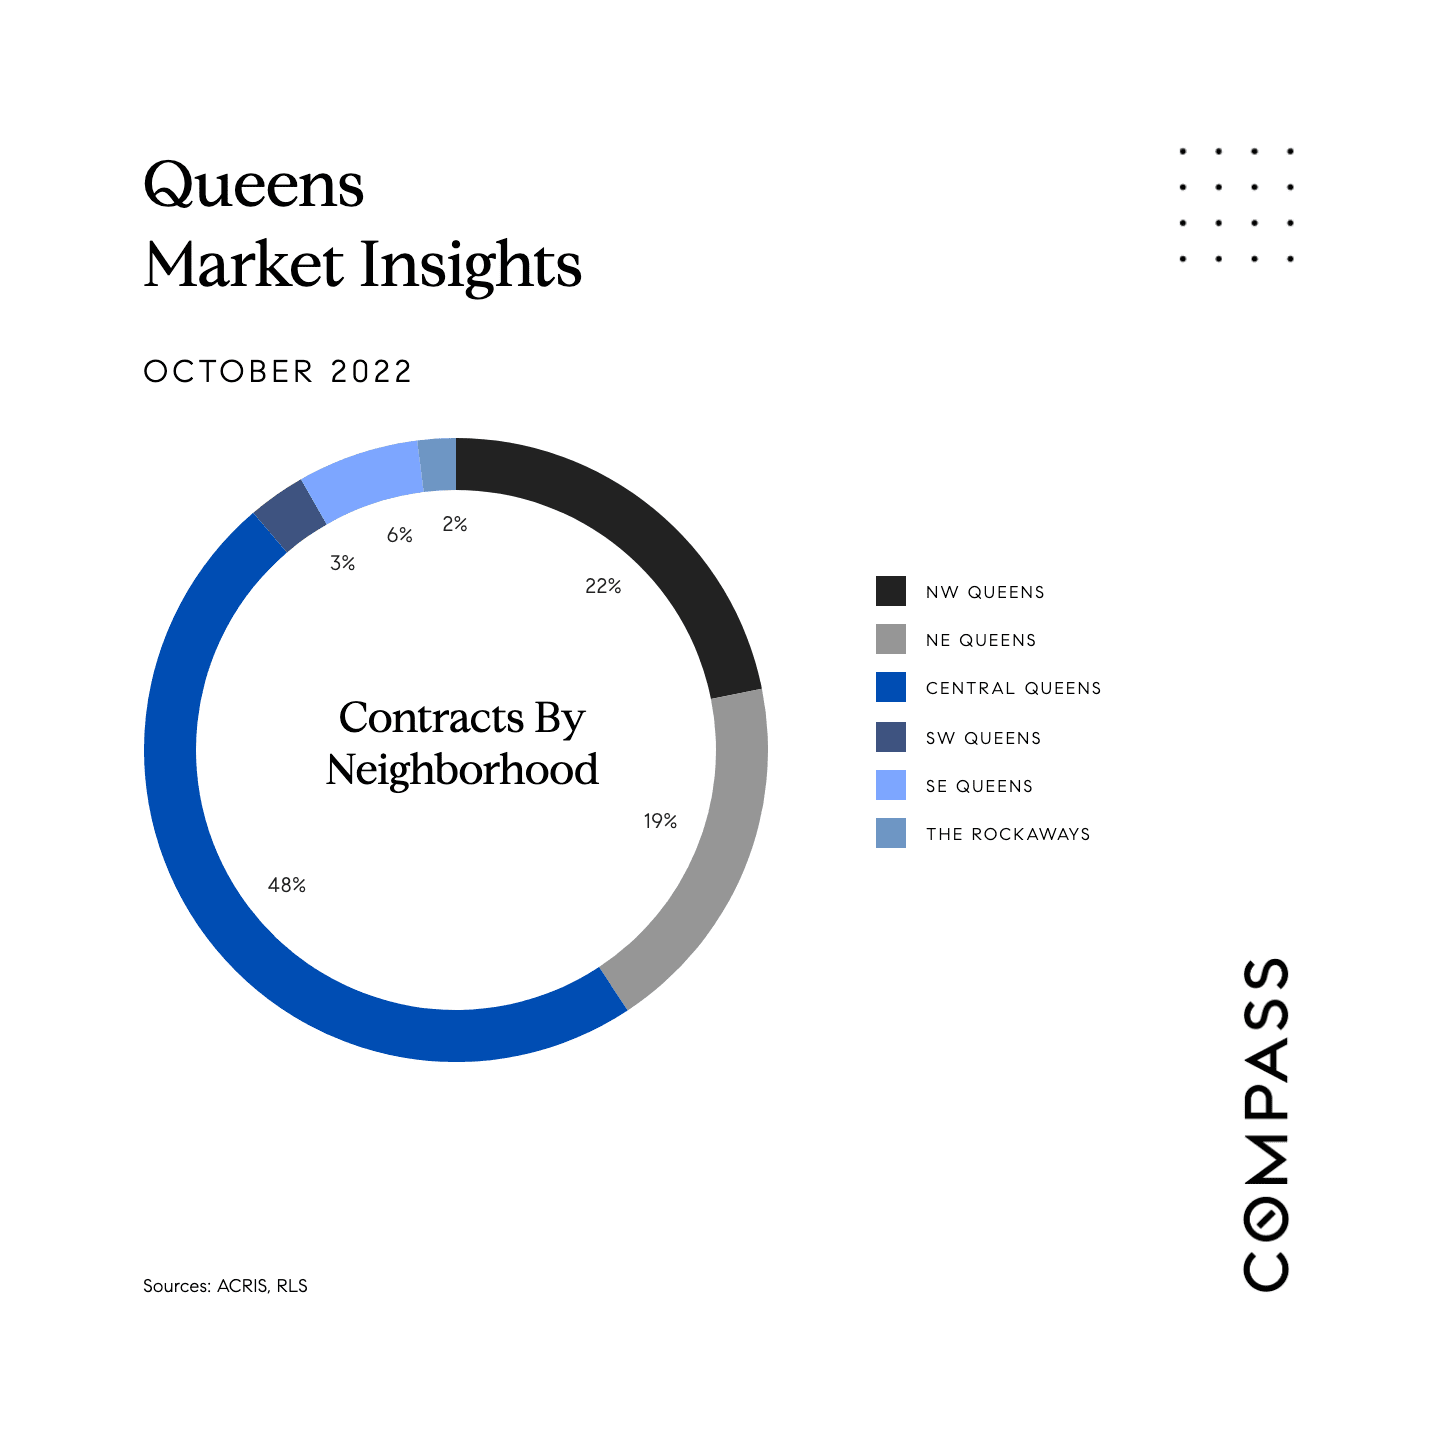
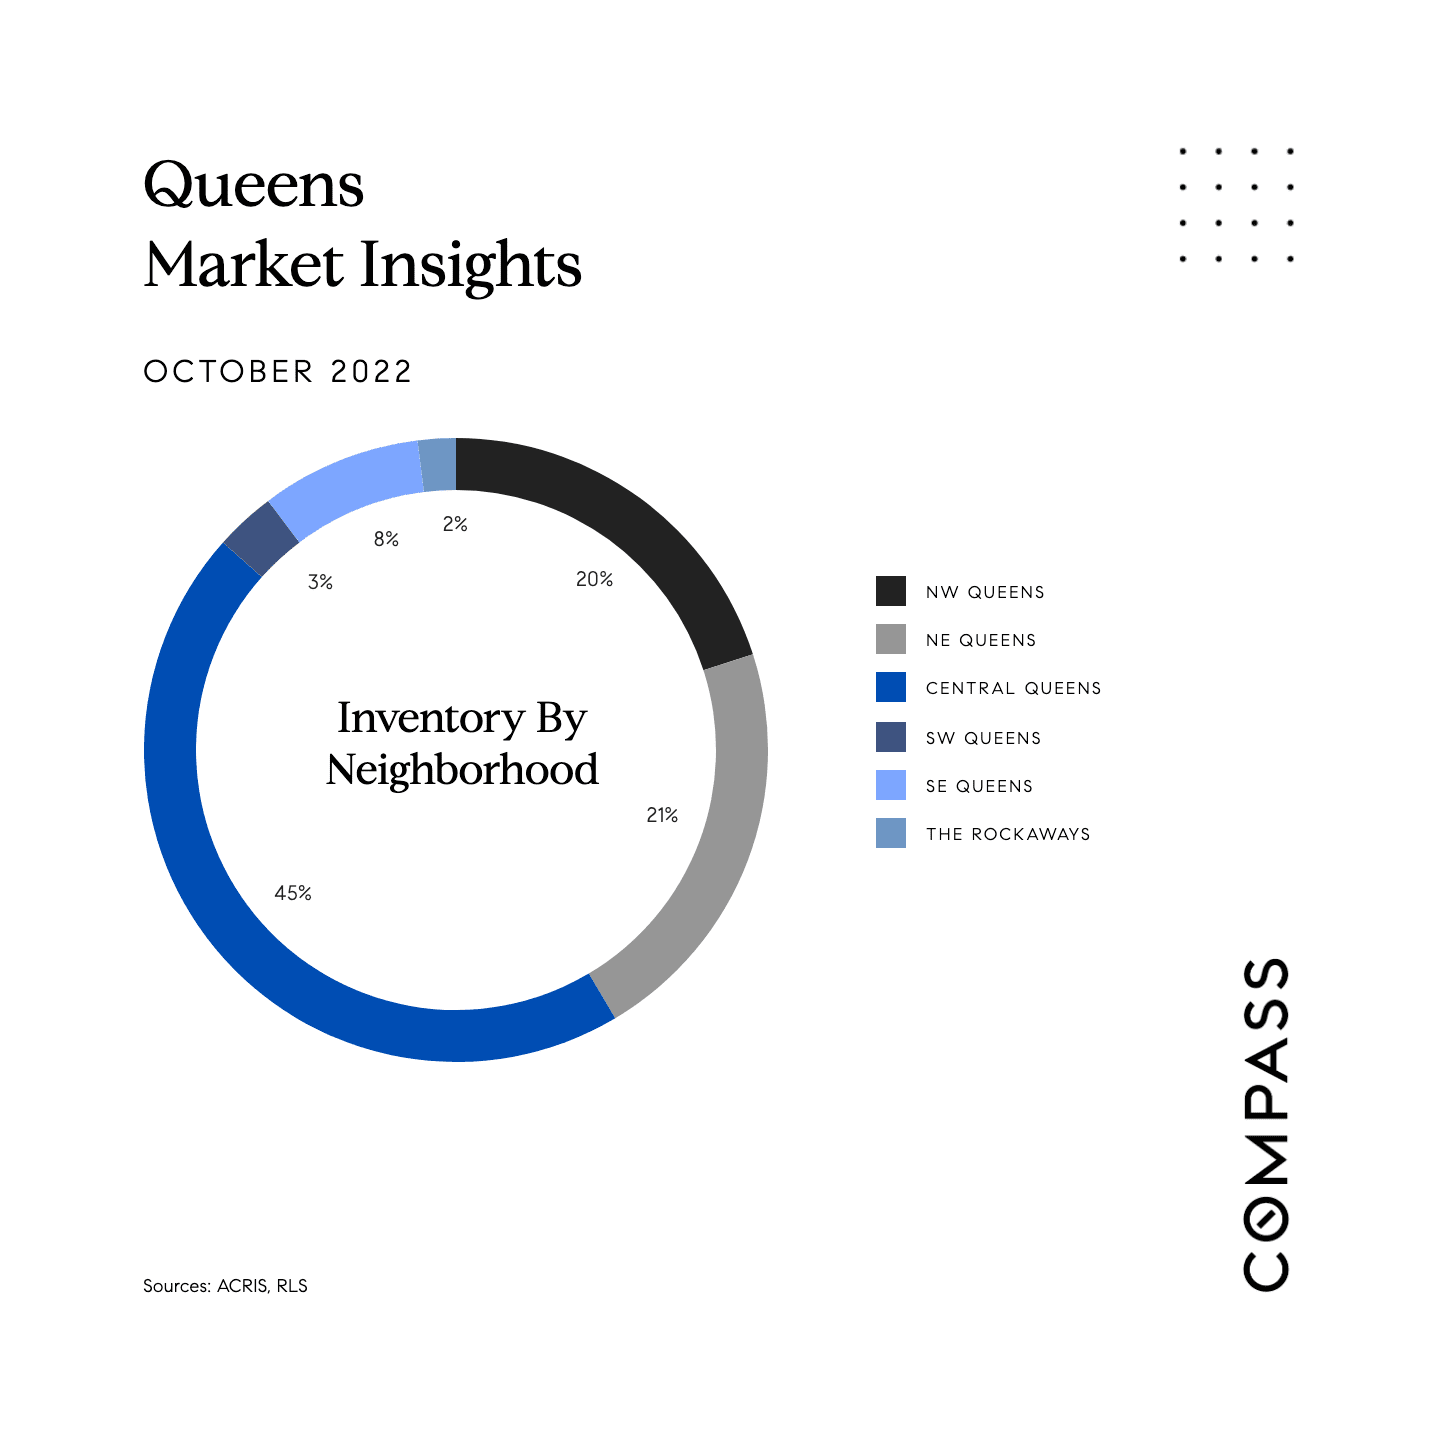
Manhattan October 2022 market report: average condo sales price $2.4M, co-op $1.2M, inventory down 1.2%.Manhattan October 2022 market infographic with condo and co-op prices, inventory, and days-on-market changes.October 2022 Manhattan contracts by neighborhood: Downtown leads at 27%, followed by the Upper East Side at 24%.October 2022 Manhattan inventory by neighborhood: Downtown 23%, Upper East Side 21%, Midtown East 19%, and other areas.Brooklyn October 2022 market report: average home prices, inventory decrease, days-on-market increase, and average discount.Brooklyn October 2022 market snapshot with average sale prices and decreases in inventory, days on market, and contracts.October 2022 Brooklyn contracts by neighborhood: North 11%, NW 34%, East 14%, and South 41%.Brooklyn October 2022 inventory by neighborhood: North 10%, Northwest 22%, East 15%, and South 53%.October 2022 Queens market report: $914K average condo, $377K co-op, and $1.0M house sale prices, with market changes.Queens October 2022 market insights: average sales prices and year-over-year changes in inventory, days on market, and contracts.October 2022 Queens contracts by neighborhood chart, led by Central Queens at 48%, with Compass branding.Queens October 2022 inventory chart: Central Queens 45%, NE Queens 21%, NW Queens 20%, and other neighborhoods.

Work With Us

For an unparalleled real estate experience where your real estate goals can truly thrive, look no further than Thrive Real Estate Team at Compass.